Welcome to the final lesson in our analysis module. In the last session, you learned how to quantify temporal changes, measuring by how much violation rates changed during specific periods like the monsoon season. This gave you powerful, reportable numbers about the timing of meal quality issues.
Today, we shift from "when" to "what." We will address a key question from your project plan: is there a statistical link between the type of school and the presence of meal quality violations? To answer this, you will learn to perform a chi-square test of independence. This statistical test is the standard method for determining whether a significant association exists between two categorical variables. By the end of this lesson, you will be able to implement this test in Python and interpret its results to draw meaningful conclusions for your final report.
The Chi-Square Test: A Framework for Association
The chi-square () test of independence is a hypothesis test used to determine if there's a significant relationship between two categorical variables. In your project, the variables are:
- School Type: A categorical variable, e.g., 'Government', 'Aided', 'Private'.
- Violation Presence: A binary categorical variable you can create, e.g., 'Violation' or 'No Violation'.
The core idea of the test is to compare the frequencies you observe in your data with the frequencies you would expect to see if the two variables were truly independent (i.e., had no relationship). A large difference between observed and expected values suggests an association.
The process follows a standard statistical workflow, as outlined in the diagram below.

For a foundational understanding of the test and its purpose, the article "Chi-square Test Of Independence In Python" is an excellent starting point.
Chi-square Test Of Independence In Python (Full Code) - EML
This article explains what the chi-square test is, why it's used for categorical variables, and how it differs from similar tests.
Read the introductory sections to understand the core purpose of the test. Focus on the sections titled "What Does A Chi-Square Test Of Independence Tell You?" and "Why Do We Use Categorical Variables?". This will solidify the conceptual basis before we dive into the implementation.
Step 1: Stating the Hypotheses
Every hypothesis test begins with a clear statement of what you are testing. For your project, the hypotheses are:
- Null Hypothesis (H₀): There is no association between school type and the presence of a meal quality violation. The two variables are independent.
- Alternative Hypothesis (Hₐ): There is an association between school type and the presence of a meal quality violation. The two variables are dependent.
Our goal is to see if we have enough evidence in our data to reject the null hypothesis in favor of the alternative. We'll make this decision based on a p-value, using a conventional significance level (alpha) of .
Step 2: Preparing the Data with a Contingency Table
To run the test, you first need to summarize your data in a contingency table. This table shows the number of observations (frequency) for each combination of categories of your two variables.
For your project, it would look something like this:
| School Type | Violation | No Violation | Total |
|---|---|---|---|
| Government | 50 | 150 | 200 |
| Aided | 30 | 70 | 100 |
| Total | 80 | 220 | 300 |
This table of observed frequencies is what we will test against the expected frequencies that the test calculates under the assumption of independence.
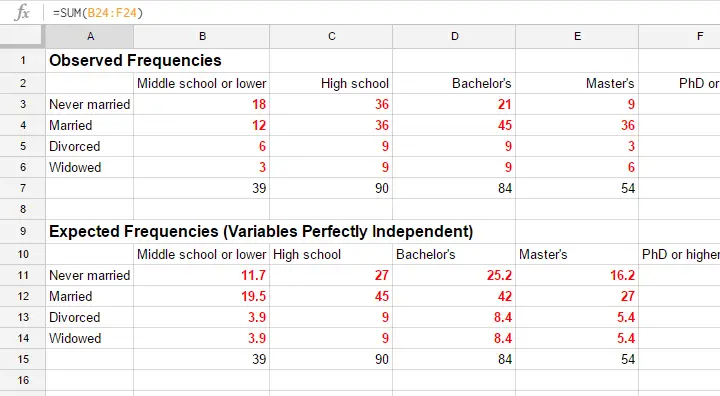
Creating this table in Python is straightforward with the pandas.crosstab function. It takes two series (your two categorical columns) and computes the frequency table automatically.
Chi-square Test Of Independence In Python (Full Code) - EML
This section of the previously mentioned article shows the simple line of code needed to generate a contingency table.
Focus on the subsection "How To Make A Contingency Table In Python". Note how pd.crosstab() is used to create the table from two DataFrame columns.
Step 3 & 4: Performing the Test in Python
With the contingency table ready, you can perform the chi-square test using the chi2_contingency function from the scipy.stats library. This function does all the heavy lifting: it calculates the expected frequencies, the chi-square statistic, the p-value, and the degrees of freedom.
The following video provides a clear walkthrough of both the manual logic and the convenient scipy implementation.
Python for Data Analysis: Chi-Squared Tests
This video from DataDaft explains how the chi-square test of independence works and demonstrates its implementation in Python.
First, watch the conceptual explanation from the test of independence to understand how expected counts are calculated from row and column totals. Then, jump to the section on using scipy from the chi2_contingency function, which shows the practical application you will use.
Here is a complete code snippet you can adapt for your project. Let's assume you have a DataFrame df with columns school_type and has_violation.
import pandas as pd
import scipy.stats as stats


# --- 1. Prepare your data ---
# Assume 'df' is your DataFrame.
# For demonstration, let's create some sample data.
data = {
    'school_type': ['Govt', 'Aided', 'Govt', 'Govt', 'Aided', 'Govt'] * 50,
    'has_violation': ['Yes', 'No', 'No', 'No', 'Yes', 'Yes'] * 50
}
df = pd.DataFrame(data)


# --- 2. Create the contingency table ---
contingency_table = pd.crosstab(df['school_type'], df['has_violation'])
print("Contingency Table (Observed Frequencies):")
print(contingency_table)
print("-" * 30)


# --- 3. Perform the chi-square test ---
chi2, p_value, dof, expected_freq = stats.chi2_contingency(contingency_table)


# --- 4. Print the results ---
print(f"Chi-Square Statistic: {chi2:.4f}")
print(f"P-value: {p_value:.4f}")
print(f"Degrees of Freedom: {dof}")
print("\nExpected Frequencies:")
print(pd.DataFrame(expected_freq, index=contingency_table.index, columns=contingency_table.columns))
Step 5: Interpreting the Results
The most important output from the test is the p-value.
- If p-value < 0.05, you reject the null hypothesis. This means there is a statistically significant association between school type and the presence of violations. This is a finding worth reporting!
- If p-value ≥ 0.05, you fail to reject the null hypothesis. This means you do not have enough statistical evidence to conclude that an association exists.
In our example code, if the p-value were, say, 0.02, you would conclude that the type of school is significantly associated with the likelihood of a meal violation.
Step 6: Measuring the Strength of Association with Cramer's V
A low p-value tells you an association exists, but it doesn't tell you how strong that association is. For this, we use a measure of effect size called Cramer's V. It's a value between 0 and 1:
- 0: No association.
- ~0.1: Weak association.
- ~0.3: Moderate association.
- ~0.5 or higher: Strong association.
Calculating Cramer's V gives your analysis more nuance. A statistically significant but weak association might be less important than a moderate or strong one. The article "Contingency Tables, Chi-Squared and Cramer's V" provides a clear guide and a Python function to calculate it.
Contingency Tables, Chi-Squared and Cramer's V | Towards Data Science
This article provides an end-to-end example, from creating contingency tables to performing the test and calculating the effect size.
First, quickly review the Hypothesis Test section to see another example of interpreting the chi-square results. Then, focus on the Effect Size section, which introduces Cramer's V and provides a Python function to calculate it. You can adapt this function directly for your project.
Here's how you could implement the calculation in your script, using the chi2 statistic and the total number of observations:
import numpy as np


# (Continuing from the previous code block)


# --- 5. Calculate Cramer's V ---
n = contingency_table.sum().sum()  # Total number of observations
phi2 = chi2 / n
r, k = contingency_table.shape
cramers_v = np.sqrt(phi2 / min(r - 1, k - 1))

print(f"\nCramer's V: {cramers_v:.4f}")
This final value gives you a single, interpretable number that quantifies the strength of the relationship, adding a professional layer to your analysis.
Conclusion
In this lesson, you've learned how to use the chi-square test of independence to formally investigate the relationship between categorical variables in your dataset. This powerful statistical tool moves your analysis beyond simple observation to data-driven inference.
Here are the key takeaways:
- The chi-square test of independence assesses if a statistically significant association exists between two categorical variables.
- The process involves stating hypotheses, creating a contingency table (
pd.crosstab), and running the test usingscipy.stats.chi2_contingency. - The p-value determines statistical significance: if p < 0.05, you can conclude an association exists.
- Cramer's V measures the effect size, or strength of the association, providing crucial context to your findings.
This lesson marks the end of our analysis module. You have now explored your data from multiple angles: image features, text complaints, geospatial hotspots, temporal trends, and now, statistical associations.
In the final module, we will focus on Project Synthesis & Reporting. You will learn how to bring all these disparate pieces together into a cohesive, end-to-end pipeline and generate the key artifacts needed for your final report and presentation.