Welcome to Module 9. In our previous lessons, we focused on the "where" of your project, culminating in the use of Local Moran's I to pinpoint statistically significant geographic hotspots and coldspots of meal quality violations. You now have the tools to create a map that clearly identifies problem districts.
In this lesson, we pivot from spatial to temporal analysis—from "where" to "when." Your project plan calls for an investigation of seasonal variations and the impact of events like festivals on meal quality. We will address this by learning how to aggregate and plot your meal quality metrics over time. By the end of this lesson, you will be able to transform your time-stamped data into compelling visualizations that reveal weekly patterns, seasonal trends (like a drop in quality during the monsoon), and long-term changes.
Preparing Your Data for Time Series Analysis
Before we can analyze trends, your data must be structured correctly. For time series analysis in pandas, this means ensuring dates are represented not as simple strings, but as datetime objects. The most effective way to work with this data is to set the datetime column as the DataFrame's index, creating a DatetimeIndex. This unlocks a powerful suite of time-based indexing and analysis tools.
Let's assume your data, after processing and model predictions, is in a pandas DataFrame with columns like date, quality_score, and violation_count. The first step is to correctly parse the date column.
The following video from Corey Schafer provides a clear, practical guide on how to convert string columns to datetime objects and set them as an index.
Python Pandas Tutorial (Part 10): Working with Dates and Time Series Data
This video covers the fundamentals of handling date and time data in pandas.
First, watch the section on converting strings to datetimes from this segment. It explains how to use pd.to_datetime and, crucially, how to use the format argument if your dates are in a non-standard format. Next, see how setting a DatetimeIndex simplifies filtering. Watch the part from setting the index. This will be the standard structure for your temporal analysis.
Once your DataFrame has a DatetimeIndex, you can easily extract time-based features like the month or day of the week, which will be essential for analyzing seasonality. The "Time Series Analysis with Pandas" tutorial provides an excellent overview of this process.
Tutorial: Time Series Analysis with Pandas
This guide from Dataquest is a comprehensive introduction to pandas time series capabilities.
Read the sections titled "Time series data structures" and "Creating a time series DataFrame." Pay close attention to how the author uses pd.to_datetime and set_index. Also, note the example of creating new columns like 'Year', 'Month', and 'Weekday Name' from the index. You will do the same to prepare for seasonal analysis.
Your initial code to prepare your DataFrame, which we'll call df, would look something like this:
import pandas as pd


# Assume 'df' is your DataFrame
# Convert the 'date' column to datetime objects
df['date'] = pd.to_datetime(df['date'])


# Set the 'date' column as the index
df.set_index('date', inplace=True)


# Create columns for easier grouping later
df['month'] = df.index.month
df['day_of_week'] = df.index.day_name()


# Sort the index to ensure chronological order for plotting
df.sort_index(inplace=True)
Visualizing and Aggregating Trends Over Time
With your data prepared, you can start exploring. The most straightforward approach is to plot your metrics over time. However, daily data can be very "noisy," making it difficult to see underlying patterns. Two key techniques help us manage this: resampling and rolling windows.
Resampling
Resampling changes the frequency of your time series. For your project, you'll likely downsample your daily data into weekly or monthly aggregates. This involves grouping data points into time bins (e.g., all days in a week) and applying an aggregation function like .mean(), .sum(), or .count(). This is perfect for calculating the average weekly quality score or the total number of violations per month.
The Dataquest tutorial provides a clear explanation of how to use the .resample() method.
Tutorial: Time Series Analysis with Pandas
This section explains how to aggregate your data to different time frequencies.
Read the entire "Resampling" section. Focus on how to resample to a weekly frequency using .resample('W').mean(). Also, observe how they resample to monthly totals using .resample('M').sum(). These are the exact operations you will use.
If you need to apply different aggregations to different columns simultaneously (e.g., mean of quality_score but sum of violation_count), the .agg() method is extremely useful.
Python Pandas Tutorial (Part 10): Working with Dates and Time Series Data
This part of Corey Schafer's video demonstrates how to use the powerful .agg() method with resampling.
Watch the segment from resample multiple columns. The instructor shows how to pass a dictionary to .agg() to apply specific functions (mean, max, sum) to different columns in a single step.
Rolling Windows
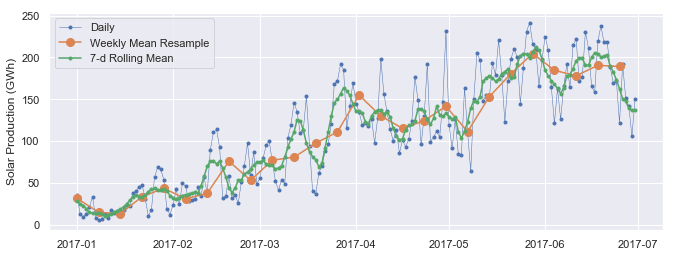
A rolling window calculates an aggregate over a sliding window of a fixed size (e.g., a 7-day rolling average). Unlike resampling, it maintains the original frequency of the data but produces a smoothed version. This is excellent for visualizing a trend line that isn't as jagged as the raw data.
The following image and reading illustrate the difference between resampling and a rolling mean.
Tutorial: Time Series Analysis with Pandas
These sections explain rolling windows and how to use them to identify trends.
First, read the "Rolling windows" section to understand the concept and how to implement it with .rolling(). Pay attention to the plot comparing daily, weekly resampled, and rolling mean data. Then, read the "Trends" section to see how a longer rolling window (365-day) can reveal long-term trends by smoothing out seasonality.
Analyzing Seasonality with Plots
Now you can use these techniques to create plots that directly address your project's questions about seasonality.
Box Plots for Monthly and Weekly Patterns
To check for a drop in quality during the monsoon season (roughly June-September in many parts of India), you can group your data by month and create box plots. This will show the distribution of quality scores for each month, making it easy to spot if certain months have consistently lower scores. Similarly, grouping by day of the week can reveal any weekly patterns.
Tutorial: Time Series Analysis with Pandas
This section demonstrates using box plots to explore seasonality.
Focus on the "Seasonality" section. The examples showing how to create box plots grouped by Month and by Weekday Name are directly applicable to your analysis of meal quality scores.
Seasonal Decomposition
A more formal way to analyze temporal patterns is seasonal decomposition, which separates a time series into three components:
- Trend: The long-term progression of the series (e.g., is meal quality generally improving over the years?).
- Seasonality: The repeating, periodic patterns (e.g., yearly monsoon effect, weekly cycles).
- Residual: The leftover "noise" after removing the trend and seasonality.
This video provides an excellent conceptual overview.
What is Time Series Decomposition? - Time Series Analysis in Python
This video from Egor Howell breaks down the concept of time series decomposition.
First, watch the introduction to understand the three components: Trend, Seasonality, and Residual. Then, pay attention to the explanation of additive vs. multiplicative models. An additive model assumes seasonal fluctuations are constant, while a multiplicative model assumes they are proportional to the trend (e.g., quality drops by 10% in monsoon, not by a fixed 0.5 points). Given your data, a multiplicative model is often a good starting point.
The statsmodels library makes it incredibly easy to perform this decomposition. The resulting plots provide a powerful summary of your data's temporal structure.

The GeeksforGeeks article provides the code to generate such a plot.
How to plot Timeseries based charts using Pandas? - GeeksforGeeks
This article gives a concise example of implementing seasonal decomposition.
Read section "5. Seasonal Decomposition". The code shows how to use sm.tsa.seasonal_decompose. You will need to specify model='multiplicative' and choose an appropriate period. For yearly seasonality in daily data, the period would be 365. For weekly seasonality, it would be 7.
Conclusion
In this lesson, you've learned the fundamental techniques for temporal analysis in pandas. You can now take your time-stamped data and transform it into insightful visualizations that reveal underlying trends and patterns.
Here are the key takeaways:
- Data Preparation is Key: Always convert date columns to a
datetimetype and set them as the DataFrame index for effective analysis. - Aggregate to See the Big Picture: Use
.resample()to group your data into daily, weekly, or monthly buckets to calculate aggregate metrics like mean quality or total violations. - Smooth to Find the Trend: Use
.rolling()to compute moving averages, which smooths out noise and helps visualize the underlying trend. - Visualize Seasonality: Use line plots of resampled data and box plots grouped by month or day of the week to identify recurring patterns like monsoon effects or weekly cycles.
- Decomposition Provides Structure: Use
statsmodels.tsa.seasonal_decomposeto formally separate your time series into trend, seasonal, and residual components for a comprehensive overview.
You now have the tools to complete the temporal analysis portion of your project. In the next lesson, we will build on this by using statistical tests, such as the chi-square test, to quantify the strength of the relationship between categorical variables, like school type and violation presence.