Welcome to the final module of our course. Over the past nine lessons, you have built an impressive array of components for your Midday Meal Quality Monitoring project. You've scraped data, processed images with CNNs, analyzed text with BERT, detected food items with YOLO, and performed sophisticated geospatial and statistical analyses. Now, it's time to assemble these individual pieces into a coherent whole.
This lesson addresses a key concern you raised early on: understanding how to achieve pipeline integration. We will zoom out from the individual models and analyses to design a high-level blueprint of your entire system. The goal is to create a flowchart that illustrates the complete data journey, from a raw tweet or complaint to a final, actionable insight like a violation hotspot map. This visualization is not just a crucial part of your final report; it's a vital tool for clarifying dependencies and solidifying your own understanding of the project's architecture.
The Anatomy of a Machine Learning Pipeline
Before we design your specific pipeline, let's establish a shared vocabulary. At its core, your project is a machine learning pipeline: a sequence of steps that transforms raw data into a useful output, in your case, predictions and analyses about meal quality.
A typical ML project follows a standard lifecycle, as illustrated in the flowchart below. You'll recognize many of these stages from your own work over the past few weeks.

To understand the structure more formally, we can break down an ML pipeline into distinct stages. An excellent article from the Quix blog provides a clear overview of this structure.
The anatomy of a machine learning pipeline
This article offers a comprehensive breakdown of ML pipelines, which will serve as the conceptual foundation for designing your flowchart.
Please read the following sections: Start with the definition of an ML pipeline. Review the table under the heading "End-to-end overview" which outlines the main stages. Finally, read through the descriptions of each step, from Step 1 to Step 6. Pay close attention to how the author separates data gathering, preprocessing, feature generation, model training, and deployment/monitoring.
As you read, try to map these generic steps to the specific actions you've taken in your project. For instance, "Data gathering" corresponds to your use of PRAW and BeautifulSoup, while "Feature generation" includes extracting embeddings from your CNN and BERT models.
From Pipeline to DAG: Visualizing Dependencies
The steps in a pipeline are not just a simple list; they have dependencies. You can't train a model before you've preprocessed the data, and you can't generate a hotspot map before you have model predictions. This network of tasks and dependencies is formally known as a Directed Acyclic Graph (DAG).
Thinking of your pipeline as a DAG is the key to creating a meaningful flowchart. Each task becomes a "node," and each dependency becomes a directed "edge" (an arrow). The following video provides a great introduction to this concept.
How to Build Data Pipelines for ML Projects (w/ Python Code)
This video by Shaw Talebi explains the core components of data pipelines (Extract, Transform, Load) and introduces the concept of representing them as DAGs using orchestration tools.
Please watch the following segments: The introduction explains the ETL (Extract, Transform, Load) and ELT paradigms. Your project largely follows an ETL pattern for each modality before fusion. The section on extraction discusses APIs and custom scraping, which directly relates to your data acquisition phase. The segment on transformation covers data cleaning and feature engineering, which you've done for both your image and text data. Most importantly, watch the section on orchestration from "bring it all together". This is where the concept of a DAG is introduced, providing the mental model for our flowchart.
Deconstructing Your Project into Flowchart Nodes
Now, let's apply the DAG concept to your project. We'll break down your entire workflow into a series of connected nodes. Your pipeline is particularly interesting because it processes multiple data types (modalities) in parallel before fusing them.
Here is a logical breakdown of your project's flow:
-
Data Ingestion:
- Sources: Reddit, Twitter, Government Portals, WhatsApp Screenshots.
- Process: Scraping and collection scripts.
- Output: A raw dataset of images, text, and associated metadata (e.g., location, date).
-
Parallel Processing Streams: This is where the different data modalities are handled independently.
-
Image Stream:
- Input: Raw meal photos.
- Processes:
- Preprocessing: Resize, convert color space, apply augmentations.
- YOLO Feature Engineering: Run pretrained YOLOv8 to detect food items. Calculate the area of bounding boxes to estimate portion size.
- CNN Feature Extraction: Pass the preprocessed image through your fine-tuned ResNet model (in evaluation mode) to extract a fixed-size feature vector from a penultimate layer.
- Output: Image feature vector, portion size feature.
-
Text Stream:
- Input: Raw text complaints.
- Processes:
- Preprocessing: Clean text (remove URLs, special characters).
- BERT Feature Extraction: Tokenize the text and pass it through your fine-tuned BERT model (in evaluation mode) to extract the
[CLS]token embedding.
- Output: Text feature vector.
-
Metadata Stream:
- Input: Raw metadata (e.g., school type, district, date).
- Processes:
- Temporal Engineering: Extract features like 'season' or 'month' from the date.
- Categorical Encoding: Convert categorical features like 'school type' into numerical format (e.g., one-hot encoding).
- Output: Metadata feature vector.
-
-
Multimodal Fusion: This is where the parallel streams converge.
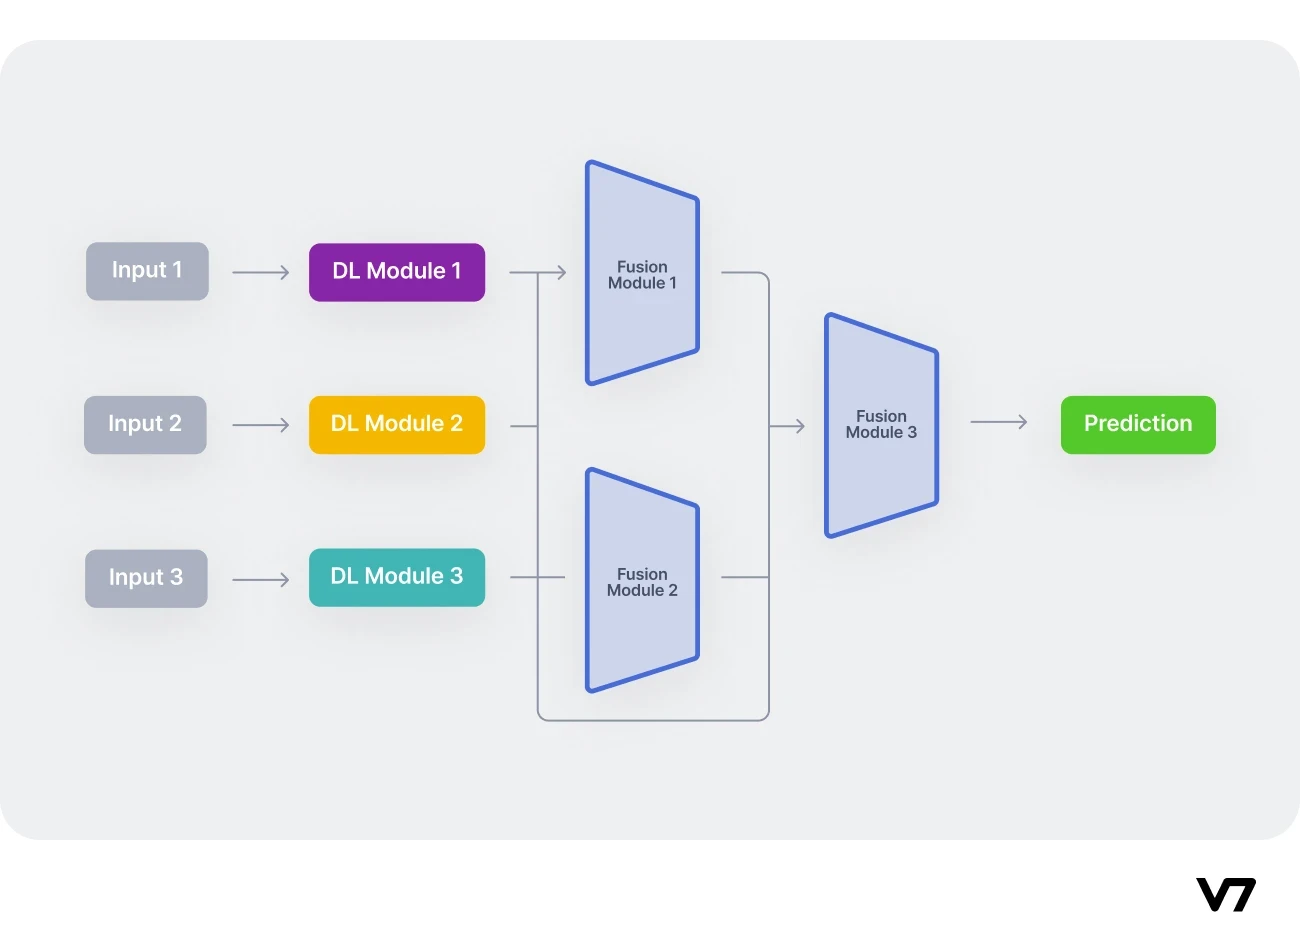
*   **Input:** Image feature vector, text feature vector, metadata feature vector.
*   **Process:** Concatenate all feature vectors and feed them into a trained fusion model (e.g., a simple Multi-Layer Perceptron - MLP).
*   **Output:** A final prediction for each data point (e.g., violation severity score, quality category).
4. Downstream Analysis: The model's predictions are now used to generate insights.
* Geospatial Analysis:
* Process: Aggregate predictions by district/state, merge with GeoPandas dataframes, and run Moran's I / LISA analysis.
* Output: Violation hotspot maps.
* Temporal & Statistical Analysis:
* Process: Aggregate predictions by time to find trends. Create contingency tables (e.g., school type vs. violation) and perform chi-square tests.
* Output: Trend plots and statistical significance reports.
- Synthesis:
- Process: Consolidate maps, plots, and statistical results.
- Output: Final project report and presentation.
Creating Your Flowchart with Mermaid.js
With this structure in mind, you can now create the flowchart. While you could use a drag-and-drop tool, your background in programming makes a "diagram-as-code" tool like Mermaid.js an excellent choice. It uses a simple, Markdown-like syntax to generate clean, professional diagrams. This also makes your flowchart version-controllable with Git, just like the rest of your project code.
The following resource is a great starting point for learning the syntax.
Learn Mermaid.js - SimpleMermaid
This guide provides a quick and comprehensive introduction to the Mermaid.js syntax you'll need.
Please review the following sections: Getting Started: Understand the basic structure (flowchart TD, nodes, and connections). Flowchart Type: See a slightly more complex example with a decision node. Node Shapes & Styles: Learn how to use different shapes to represent different types of steps (e.g., a cylinder for a database/dataset, a diamond for a decision). Connections: See how to label arrows. Subgraphs: This is a critical feature for your project. You will use subgraphs to visually group the parallel processing streams. Finally, read the Best Practices section. The advice on using descriptive labels, breaking up complex diagrams, and grouping related items is particularly relevant.
For a seamless workflow, you can generate Mermaid code and then render it visually using a tool like draw.io (diagrams.net), which can import Mermaid syntax directly. The video below demonstrates this simple process.
How to create Flowcharts and Diagrams with ChatGPT
This video shows a practical workflow for creating a flowchart using an LLM to generate Mermaid code and then pasting it into draw.io for visualization and customization.
Watch how the presenter: Prompts for the code after defining the steps. You've already defined your steps above. Imports the Mermaid code into draw.io. Customizes and exports the final diagram.
Your Project Pipeline in Mermaid.js
To get you started, here is a Mermaid.js template for your project's pipeline. It uses subgraphs to organize the different stages and parallel processing streams we outlined. Your task is to review, modify, and expand this code to fully represent your project.
flowchart TD
    subgraph Data Ingestion
        direction LR
        A1[Social Media, RTI Portals] --> A2{Scraping Scripts};
        A2 --> A3[(Raw Multimodal Dataset)];
    end

    subgraph "Feature Extraction"
        direction LR

        subgraph Image Stream
            direction TD
            B1_IN[(Raw Images)] --> B1[Preprocessing & Augmentation];
            B1 --> B2[YOLOv8: Portion Estimation];
            B1 --> B3[ResNet: Get Image Embedding];
            B2 --> B_OUT_FEATURES((Image Features));
            B3 --> B_OUT_FEATURES;
        end

        subgraph Text Stream
            direction TD
            C1_IN[(Raw Text)] --> C1[Text Cleaning & Tokenization];
            C1 --> C2[BERT: Get Text Embedding];
            C2 --> C_OUT_FEATURES((Text Features));
        end

        subgraph Metadata Stream
            direction TD
            D1_IN[(Metadata: Geo, Time)] --> D1[Feature Engineering];
            D1 --> D_OUT_FEATURES((Metadata Features));
        end

    end

    subgraph "Prediction & Analysis"
        direction TD
        E1[Concatenate Features];
        E2[Fusion MLP Model];
        E3[(Violation Predictions)];

        subgraph Downstream Analysis
            direction LR
            F1[Geospatial Analysis: Hotspots];
            F2[Temporal & Statistical Analysis];
        end

        E3 --> F1;
        E3 --> F2;
    end

    G1[Final Report & Visualization];

    %% Connections
    A3 --> B1_IN;
    A3 --> C1_IN;
    A3 --> D1_IN;
    B_OUT_FEATURES --> E1;
    C_OUT_FEATURES --> E1;
    D_OUT_FEATURES --> E1;
    E1 --> E2 --> E3;
    F1 --> G1;
    F2 --> G1;
Your Task:
Copy the code above into a Mermaid editor (like the one on simplemermaid.com or in draw.io). Use it as a starting point. Feel free to change node text, add more detail where you see fit, or adjust the layout. The goal is to produce a diagram that you feel accurately and clearly represents your project's architecture.
Conclusion
In this lesson, you've taken a crucial step back to see the forest for the trees. By deconstructing your project into a formal pipeline structure and learning how to represent it as a flowchart, you've created a powerful tool for communication and self-clarification.
Key takeaways from today's lesson:
- A machine learning pipeline is a sequence of steps (often represented as a DAG) that transforms raw data into predictions and insights.
- Your multimodal project involves parallel processing streams for images, text, and metadata, which are later fused for a final prediction.
- Tools like Mermaid.js allow you to define complex diagrams as simple text, which aligns perfectly with a developer's workflow.
- A well-designed flowchart serves as a master blueprint for your system, invaluable for your final report and presentation.
In our next lesson, we will bring this flowchart to life. You will write a reusable Python script that encapsulates this entire end-to-end pipeline, allowing you to take a new, raw data point and run it through the full sequence of steps to get a final prediction.