Welcome to the final lesson in our module on Advanced Excel. So far, you've learned how to build pivot tables from raw data and customize their calculations to show sums, averages, and percentages. This has given you the ability to transform a large dataset into a meaningful summary.
Today, we'll complete your foundational pivot table skillset by focusing on how to filter, sort, and group the data within your reports. While calculating values is crucial, the ability to selectively view, organize, and aggregate your data is what truly enables deep analysis. You'll learn how to isolate specific segments of your data, rank items by performance, and roll up daily data into monthly or quarterly views. These techniques are essential for answering specific business questions and are directly analogous to the filtering and grouping you might perform in SQL with WHERE and GROUP BY, or with visual filters in Tableau and Power BI.
Filtering: Focusing on What Matters
A pivot table often starts by showing you everything. The first step in most analyses is to narrow that view to focus on a specific area of interest. Excel provides several powerful ways to filter your pivot table data.
Basic Filtering with Drop-Downs
The most direct way to filter is by using the built-in filter arrows on your Row and Column labels. This is a quick method for including or excluding specific items.
[PDF] Data Analysis with Excel: Tables and PivotTables - mngfoa
This guide from the Minnesota Government Finance Officers Association (MN GFOA) provides a clear, step-by-step walkthrough of fundamental pivot table operations.
Please read the section titled FILTERING INDIVIDUAL COLUMN AND ROW FIELDS on page 14. This will show you the classic method of filtering by selecting items from a list.
While this method is simple, it can become clumsy when dealing with many items. For a more interactive and user-friendly experience, we use Slicers.
Interactive Filtering with Slicers and Timelines
Slicers are interactive controls that let you filter your pivot table with the click of a button. They provide a clear, visual representation of what's currently being filtered, which is a huge improvement over digging through drop-down menus. This concept should feel familiar from your experience building dashboards in Power BI or Tableau. Timelines are a special type of slicer designed specifically for filtering date fields.
The following guide from XelPlus offers a great, practical walkthrough of how to implement both.
10 Excel Pivot Table Tips and Tricks (2026 Pro Guide) - XelPlus
This article from XelPlus is a collection of professional techniques for getting the most out of pivot tables. We'll focus on the filtering tools.
Please read the following three sections: Start with How to Add a Timeline Slicer to understand this powerful tool for filtering by date. Next, read how to add a standard Slicer. Focus on steps 1 and 2, which cover creating the slicer itself. Finally, review the FAQ entry that clarifies the difference between a Slicer and a Timeline.
Filtering for Top Performers: Top N Analysis
A common business question is, "Who are our top 10 salespeople?" or "What are our 5 worst-selling products?" This is known as Top N analysis, and you can perform it directly within a pivot table's filter options.
10 Excel Pivot Table Tips and Tricks (2026 Pro Guide) - XelPlus
Let's return to the XelPlus guide.
Read the section How to Show Only the Top 10 Items. This demonstrates how to use Value Filters to automatically display the top or bottom items based on a metric.
This combination of filtering tools allows you to slice and dice your data from multiple angles, quickly moving from a high-level overview to a specific, granular insight.
Sorting: Ranking and Ordering Your Data
Once you've filtered your data, the next step is often to sort it. Sorting allows you to rank items, making it easy to identify best performers, chronological order, or alphabetical lists.
Standard and Custom Sorting
Excel offers two main ways to sort: standard sorting (A-Z, Largest to Smallest) and custom sorting, where you define the order yourself.
10 Excel Pivot Table Tips and Tricks (2026 Pro Guide) - XelPlus
We'll use the XelPlus guide one last time for its excellent explanation of a more advanced sorting technique.
Read the section titled How to Custom Sort a Pivot Table. It covers both the simple drag-and-drop method for reordering items and a typing method for longer lists. This is a very useful technique when you need to enforce a specific business logic to your report's order (e.g., ensuring "High Priority" always appears before "Medium Priority").
For a quick visual demonstration of many of the filtering and sorting techniques we've discussed, watch the following clips from Kenji Explains.
Master Pivot Tables in 10 Minutes (Using Real Examples)
This video provides a concise and practical overview of pivot table features. We will focus on the sections covering sorting and filtering.
Watch the following short segments: First, see how to perform a basic sort. Next, observe how to use the traditional filter area. Finally, see how Timelines and Slicers create a more interactive filtering experience.
Grouping: Creating New Levels of Analysis
Grouping is the process of taking individual items in a pivot table row or column and bundling them into higher-level categories. The most common and powerful use of this feature is with dates. A typical dataset contains daily transactions, but for analysis, you often need to see performance by month, quarter, or year.
The image below shows the power of this transformation. On top, we have individual transaction dates. On the bottom, those same dates have been automatically grouped into quarters and months, revealing a much clearer picture of performance over time.
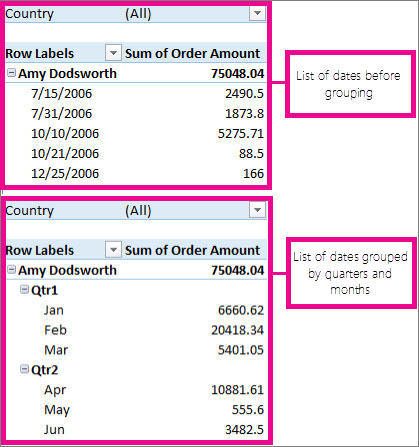
This is an incredibly useful feature that saves you from having to create separate "Month" or "Year" columns in your source data. The process is straightforward: you simply right-click a date field and choose the "Group" option.
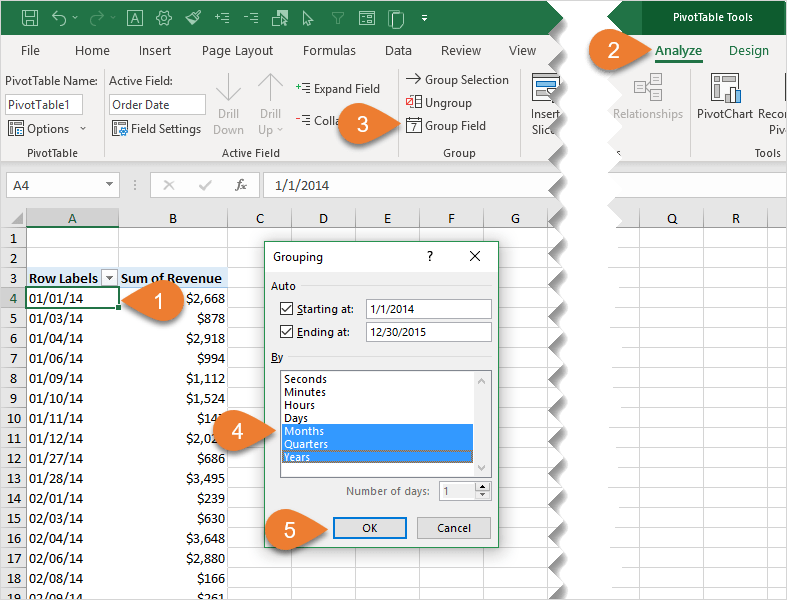
Let's read the specific instructions for how to do this.
[PDF] Data Analysis with Excel: Tables and PivotTables - mngfoa
We return to the MN GFOA guide for a clear explanation of date grouping.
On page 19, please read the section titled GROUP DATES. It provides a step-by-step guide to grouping and ungrouping date fields.
While dates are the most common use case, you can also group numerical fields (e.g., grouping ages into brackets like 20-29, 30-39) or text fields (e.g., grouping several individual states into a "Region"). This feature provides an extra layer of flexibility for summarizing your data exactly how you need to.
Conclusion
In this lesson, you've completed your tour of fundamental pivot table skills. You are now equipped to not only summarize data but to actively explore it by drilling down, reordering, and re-categorizing it on the fly.
Here are the key takeaways:
- Filtering allows you to focus on a subset of your data. You can use simple dropdowns, but Slicers and Timelines provide a much more powerful and user-friendly interactive experience.
- Top N filtering is a specific and highly useful technique for identifying top or bottom performers directly within the pivot table.
- Sorting brings order to your report. Beyond standard A-Z or numerical sorting, you can use custom sorting to enforce a specific, business-defined order.
- Grouping is essential for aggregating detailed data into meaningful categories. The most common use is grouping daily dates into months, quarters, and years to analyze trends over time.
Mastering these three pillars—filtering, sorting, and grouping—transforms the pivot table from a static report generator into a dynamic analytical workbench.
This lesson concludes our module on Advanced Excel. In our next session, we will shift gears and dive into the world of databases. Building on your existing SQL knowledge, we will explore advanced techniques, starting with how to apply conditional logic in your queries using CASE statements.