Hello! Welcome back to our module on Advanced Analytics & Performance Reporting.
In the last lesson, you built a powerful, automated SEO dashboard in Looker Studio. You mastered the critical skill of blending data from Google Search Console and Google Analytics 4, allowing you to trace the user journey from a search query all the way to a conversion. This gave you a comprehensive view of your on-site and near-site performance.
However, a huge part of SEO happens off-site. Your dashboard currently doesn't see your backlink profile, your competitors' activities, or your site's overall authority—metrics that are crucial for strategic decision-making. Today, we will fix that. Your learning outcome is to integrate third-party SEO tool data (e.g., Ahrefs) into a Looker Studio dashboard to monitor backlink and competitor metrics. This will elevate your dashboard from a performance report into a holistic strategic command center.
1. Why Integrate Third-Party Data?
While GSC and GA4 are indispensable, they only tell part of the story. Integrating data from a tool like Ahrefs allows you to:
- Monitor Backlink Profile: Track new and lost links, assess link quality (DR/UR), and analyze anchor text distribution.
- Benchmark Against Competitors: Compare your backlink growth, domain authority, and organic traffic estimates against key competitors on a single screen.
- Create a Single Source of Truth: Avoid jumping between different tool interfaces. By pulling key metrics into one dashboard, you can spot correlations and make faster, more informed decisions.
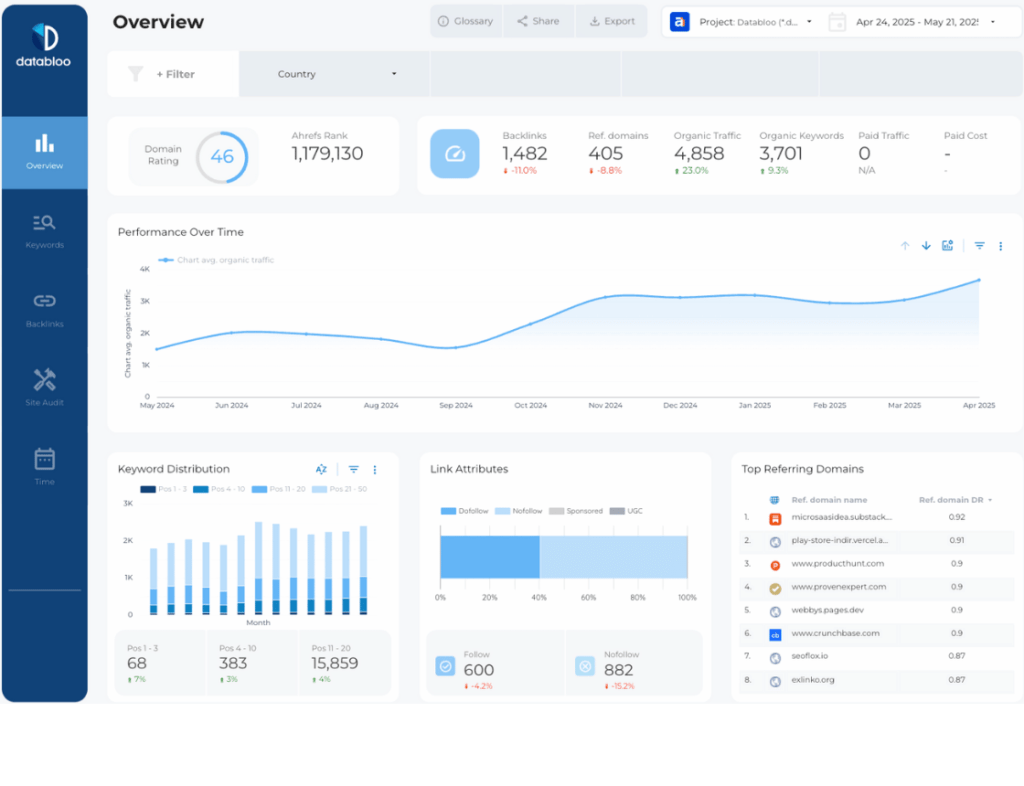
There are two primary methods to achieve this integration, each with its own trade-offs between simplicity and power. Let's explore both.
2. Method 1: The Direct Connector (The Quick & Easy Path)
The most straightforward way to get Ahrefs data into Looker Studio is by using their official data connectors. This method is perfect for creating robust dashboards quickly without needing any coding or complex setup.
Ahrefs provides several connectors for its main tools: Site Explorer, Rank Tracker, and Site Audit. For today's goal, we'll focus on the Site Explorer connector, which provides backlink and domain-level data.
How I Built a Brand Awareness Dashboard in Looker Studio
This article from the Ahrefs blog is an excellent guide to building a brand-focused dashboard, but the techniques it demonstrates for connecting and visualizing data are universally applicable. We'll focus on the sections that show how to connect the data source and what to build with it.
Please review the following sections: '1. Use an existing Ahrefs Looker Studio template': This shows you the process of creating a new data source and searching for the Ahrefs connectors. Pay attention to how you select your project. '2. Add in more data connectors': This reinforces how you can add multiple data sources to a single report. '7. Monitor your brand backlinks': This is the key section. It gives you concrete ideas for charts and tables to build using the Site Explorer data, such as visualizing link quality by Domain Rating (DR) and tracking new vs. lost links.
Building Your Backlink Monitoring View
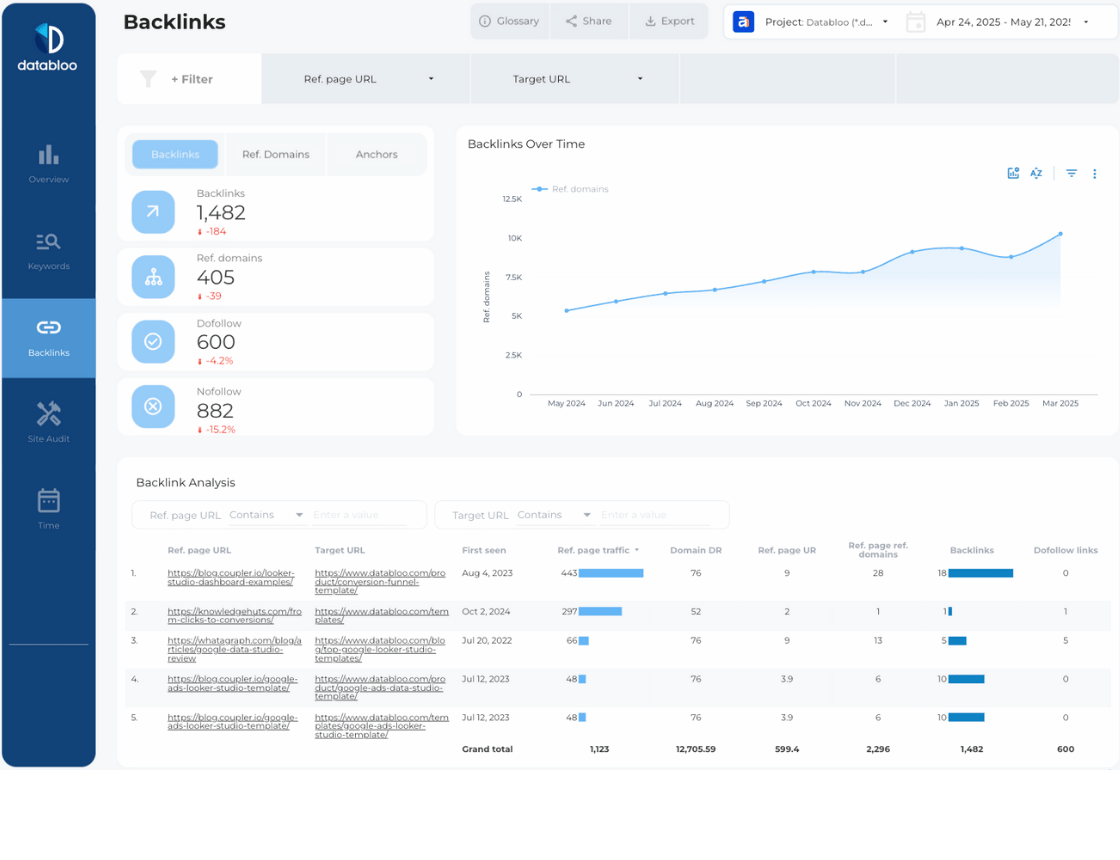
Based on the article, here’s a practical workflow to add a backlink analysis page to the dashboard you created in the previous lesson:
- Add a New Page: In your existing Looker Studio report, add a new page and name it "Backlink & Competitor Analysis."
- Add Data: Go to
Resource > Manage added data sources > Add a data source. Search for "Ahrefs Site Explorer" and connect it, authorizing your Ahrefs account and selecting your project. - Add Scorecards: Start with high-level KPIs. Add scorecards for:
Domain RatingBacklinksReferring domains
- Visualize Trends: Add a Time series chart to track
Referring domainsover theDatedimension. This shows your link acquisition momentum. - Create a Detailed Backlink Table: This is your core analysis view. Add a table with the following:
- Dimensions:
Referring page URL,Target URL,Anchor - Metrics:
Domain Rating Source,URL Rating Source,Traffic,First seen link
- Dimensions:
This will give you a powerful, sortable view of your incoming links, similar to this:
Test your understanding!
You want to add a chart to your dashboard that compares your site's Share of Voice (SoV) for a specific set of tracked keywords against three competitors. Which Ahrefs connector would you use to get this data?
Show answer
You would use the Ahrefs Rank Tracker connector. Rank Tracker is the tool within Ahrefs designed for tracking keyword positions and Share of Voice for specific projects and competitors. The Site Explorer connector focuses on domain-wide metrics and backlinks.
3. Method 2: The API Workflow (The Powerful & Scalable Path)
While the direct connector is excellent, it has limitations in terms of customization, the number of API calls it can make, and the ability to pull data for multiple competitors simultaneously in a flexible way.
For a truly scalable and custom solution—the kind required for enterprise-level or agency reporting—the best practice is to use the Ahrefs API to pull data into a data warehouse (like Google BigQuery) and then connect Looker Studio to that warehouse.
You have a background in digital marketing, not programming, so you won't be expected to write the code yourself. However, understanding the architecture of this workflow is a crucial skill for a senior SEO, as you will often need to collaborate with developers or data analysts to build these systems.
Let's walk through a strategic overview of this process.
How to Monitor Competitors' Backlinks with Ahrefs & Looker Studio
The following article from Coupler.io provides a complete, code-level walkthrough of this advanced workflow. We will use it to understand the strategy and logic, not to execute the code. Focus on the 'what' and 'why' of each step.
Read through the main sections of the article to understand the end-to-end process: 'Building a custom dashboard with Ahrefs API': Understand the rationale for using the API—flexibility and scalability. 'Preparing the list of sites to monitor': This is a key strategic step. You can use a simple Google Sheet to list your domain and your competitors, which then feeds the automation. 'Pulling data from the Ahrefs API': Look at the Python code snippets to understand the logic. Notice how the code makes a request to the Ahrefs API for specific metrics (like all-backlinks) with filters (like domain_rating_source >= 24.5). This is how you get precisely the data you need. 'Transforming data': Review the SQL query. This step happens in BigQuery to clean, format, and combine data before it gets to Looker Studio. This makes the dashboard faster and more efficient. 'Connecting Ahrefs data to Looker Studio': This final step is simple—you just connect Looker Studio to your BigQuery table or custom query.
The API Workflow in a Nutshell
Here is a summary of the advanced workflow architecture:
- Define Targets (Google Sheets): You maintain a simple list of your domain and your competitors' domains. This is your non-technical input into the system.
- Extract (Python/Automation Tool): An automated script runs on a schedule (e.g., daily). It reads the domain list and makes calls to the Ahrefs API for each domain, requesting specific data like new backlinks or domain metrics.
- Load (BigQuery): The script saves the raw data retrieved from the API into tables in a data warehouse like BigQuery. You might have one table for backlink data and another for competitor domain stats.
- Transform (SQL in BigQuery): You write a SQL query in BigQuery that joins these tables, cleans up data (e.g., formatting dates), and creates a single, optimized data source ready for visualization.
- Visualize (Looker Studio): You connect Looker Studio to this final, clean BigQuery data source and build your charts and tables, just as you would with any other data source.
This approach gives you complete control over the data you pull, how you combine it, and how often it refreshes, creating a reporting system that can scale to any number of clients or competitors.
Conclusion
You have now added a critical layer of off-page and competitive intelligence to your reporting capabilities. You have a complete picture of the SEO landscape—from SERP impressions (GSC), to on-site behavior (GA4), to off-site authority and competitor actions (Ahrefs)—all within a single dashboard.
Key Takeaways:
- Integrating third-party data from tools like Ahrefs is essential for creating a holistic SEO dashboard.
- There are two main integration methods:
- Direct Connectors: Quick, easy, and great for most standard reporting needs.
- API + Data Warehouse: A highly powerful and scalable architecture for custom, enterprise-level reporting that gives you full control.
- By adding backlink and competitor data, you can monitor your authority growth, benchmark your performance, and identify new strategic opportunities.
In our next lesson, we will focus on the final step of reporting: presentation. We will learn how to define KPIs and data visualization strategies for an executive-level SEO report, ensuring that the powerful dashboard you've built effectively communicates value and drives strategic decisions.