Introduction
In our last lesson, we connected the theoretical concept of default intensity () from reduced-form models to an observable market price: the credit spread. We established the approximate relationship , making the credit spread the crucial link for estimating real-world default probabilities.
Today, we will focus on the practical side of that equation. This lesson is all about the "S" – the credit spread itself. We will move from its conceptual definition to its concrete calculation from market data. You will learn how to compute two key types of spread: the G-spread and the more sophisticated Z-spread. This is a fundamental skill in fixed income analysis and a very practical topic for your CM2 exam.
What is a Credit Spread?
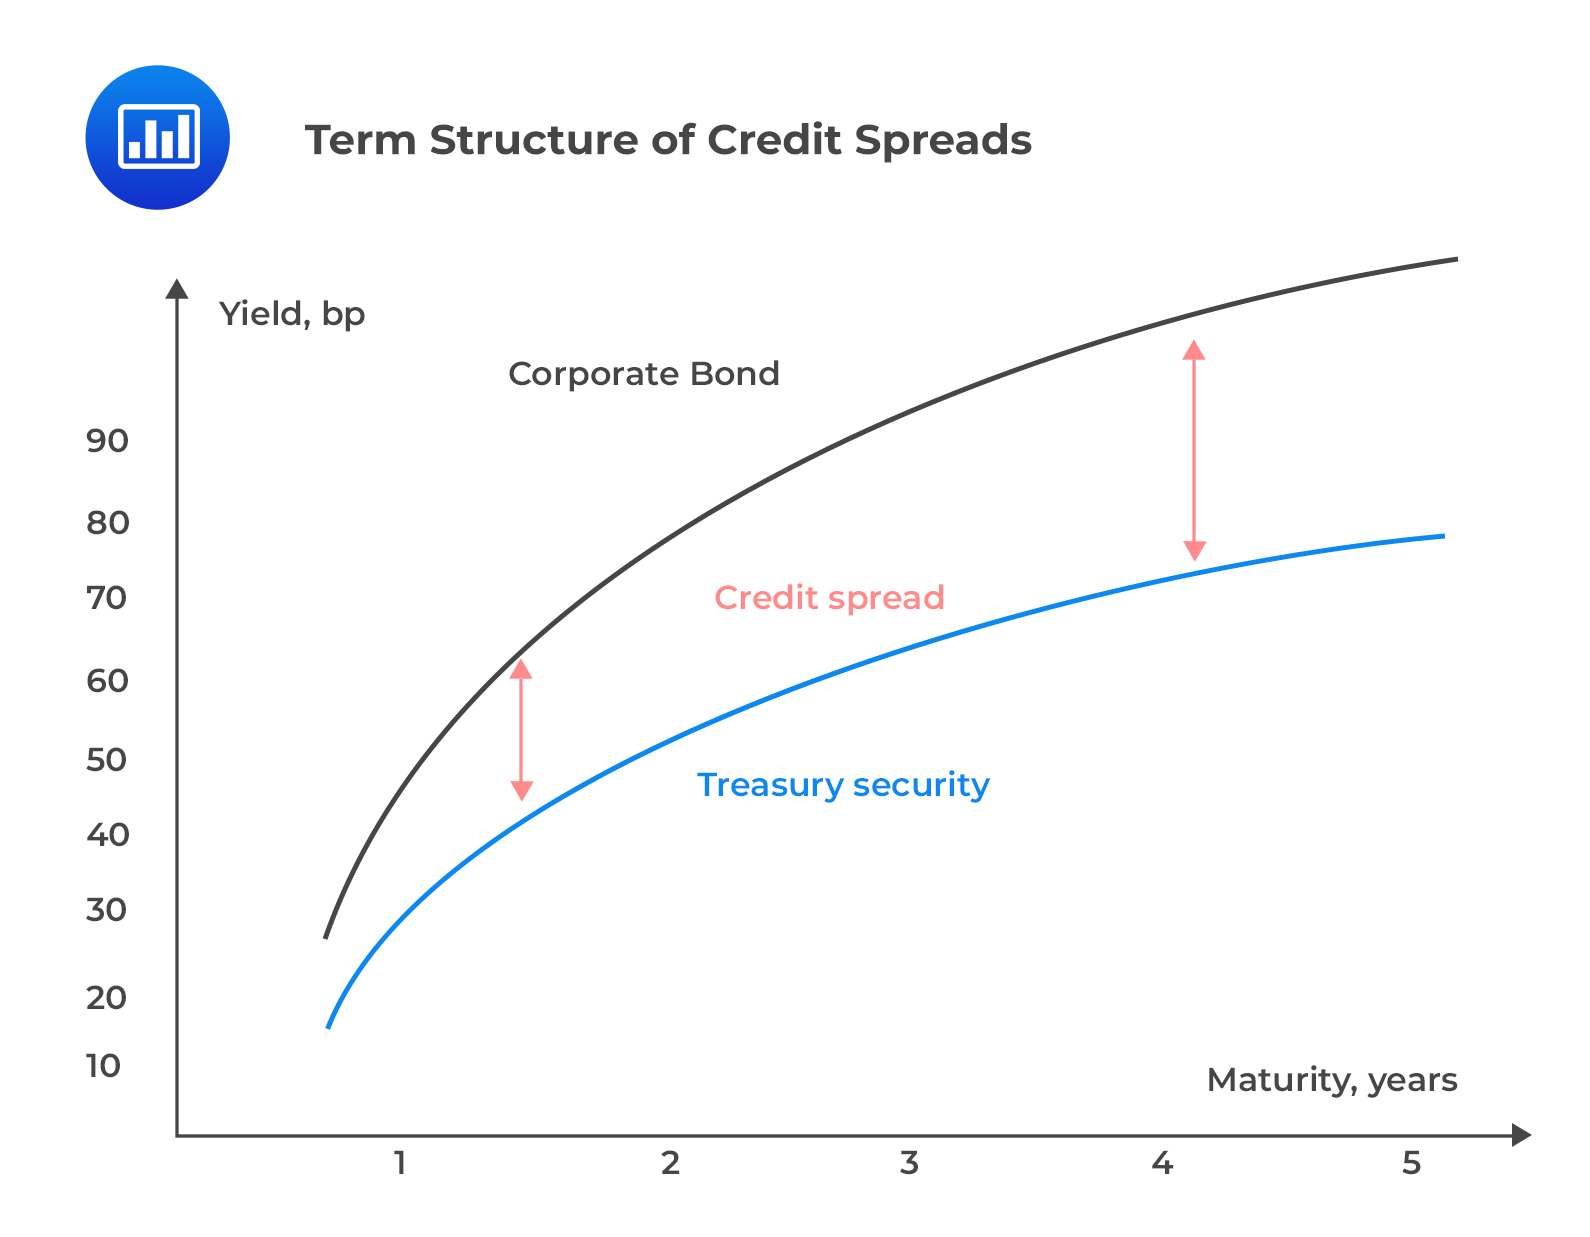
At its heart, a credit spread is simply the extra return, or yield, that an investor demands for bearing the risk that a corporate borrower might default, compared to lending to a "risk-free" entity like a stable government. It's the market's price for credit risk.
The most basic way to express this is by comparing the yields of two bonds:
Credit Spread = Yield on a Risky (Corporate) Bond – Yield on a Benchmark (Government) Bond
The benchmark is typically a government bond with a similar time to maturity, as it is considered to have minimal default risk. The difference in their yields isolates the compensation for the credit risk of the corporate issuer.

Spreads are almost always quoted in basis points (bps). A basis point is one-hundredth of a percentage point.
- 100 bps = 1.00%
- 50 bps = 0.50%
- 1 bp = 0.01%
The following video provides an excellent real-world illustration of credit spreads and introduces the basis points jargon.
Credit spreads - MoneyWeek Investment Tutorials
This MoneyWeek tutorial gives a great introduction to credit spreads, using a comparison of Italian and German government bonds to explain how spreads reflect relative risk. It also clearly defines basis points.
Please watch the following segments: First, watch the recap on bond yields, which provides the necessary foundation. Next, watch the short explanation on basis points to get comfortable with the market terminology. Finally, watch the core explanation of how credit spreads are used to compare risk between different issuers. Pay attention to the concept of a "widening" spread indicating increasing perceived risk.
The G-Spread (Government Spread)
The G-spread, or nominal spread, is the most direct application of the concept we just discussed. It is the difference between the Yield to Maturity (YTM) of a corporate bond and the YTM of a government bond of the same maturity.
The following reading provides a concise definition and a clear, exam-style worked example of calculating a G-spread.
Yield Spread Measures Explained | CFA Level 1 - AnalystPrep
This article from AnalystPrep clearly defines the different types of spreads and provides a numerical problem to solve for the G-spread.
First, read the introductory section, "What Causes Spread?", for a formal definition. Then, in the "Types of Spread" section, focus on the definition of the G-spread. Finally, work through the calculation in the "Question" section. This shows you exactly how to find the YTM for both a corporate and a government bond and then find the difference to get the G-spread in basis points.
As you saw, the process is:
- Use the bond pricing formula to solve for the YTM of the corporate bond.
- Do the same for the government benchmark bond.
- Subtract the two yields and express the result in basis points.
While simple, the G-spread has a significant flaw: it uses a single YTM for each bond. YTM is a flat average discount rate and implicitly ignores the actual shape of the government yield curve. If interest rates are expected to change (i.e., the yield curve is not flat), the G-spread can be a misleading measure of credit risk.
The Z-Spread (Zero-Volatility Spread)
To address the shortcomings of the G-spread, analysts use the Z-spread. Instead of comparing two single YTMs, the Z-spread considers the entire term structure of interest rates (the spot rate curve).
The Z-spread is the single, constant spread that must be added to each point on the risk-free (government) spot rate curve to make the present value of a risky bond's cash flows equal to its market price.
The pricing formula incorporating the Z-spread () is:
where:
- is the market price of the corporate bond.
- is the cash flow at time .
- is the risk-free spot rate for maturity .
- is the Z-spread we want to find.
Because is inside the summation and applied to each period, there is no simple algebraic solution for it. We must find it iteratively, typically using a solver function like Excel's Goal Seek or Solver.
The following video provides an excellent, practical walkthrough of calculating both the Z-spread and G-spread in Excel. This will solidify your understanding of both concepts and their differences.
Z-Spread and G-Spread Explained: Fixed Income In Excel
This video by Ryan O'Connell, CFA, FRM, demonstrates the step-by-step calculation of both the Z-spread and G-spread using a clear Excel example.
First, watch the short definitions at the beginning. Next, and most importantly, watch the detailed walkthrough of the Z-spread calculation. Pay close attention to how the Excel Solver is used to find the spread that makes the present value of cash flows equal to the market price. This is the core of the lesson. Finally, watch the demonstration of the G-spread calculation. Notice how much simpler it is, but also reflect on why it's a less precise measure than the Z-spread you just calculated.
Conclusion
In this lesson, we have moved from theory to practice, learning how to calculate the market's price for credit risk. You are now equipped to compute credit spreads from bond market data, a crucial skill for financial and actuarial analysis.
Key Takeaways:
- A credit spread is the additional yield an investor receives for taking on credit risk, typically measured in basis points (bps).
- The G-spread is a simple measure, calculated as the difference between the YTM of a corporate bond and a government bond of the same maturity. Its main weakness is that it ignores the shape of the yield curve.
- The Z-spread (Zero-volatility spread) is a more accurate measure. It is the constant spread that, when added to each spot rate on the risk-free yield curve, correctly prices the risky bond. It must be calculated using an iterative solver.
- The Z-spread is theoretically superior because it properly accounts for the term structure of interest rates.
We have now concluded our deep dive into credit risk, the last major topic in the "Financial Engineering" part of the CM2 syllabus. In our next lesson, we will pivot to the "Loss Reserving" portion, beginning with an introduction to Ruin Theory, a classic actuarial topic for modeling the solvency of an insurer.