Hello! Welcome back to our deep dive into Instagram content strategy.
In our last session, we focused on the critical first hour after posting, identifying how engagement velocity—especially the speed of shares and early watch time—acts as the primary trigger for expanded algorithmic distribution. We established that getting past the 3-second mark is the first major hurdle for any Reel.
Today, we're moving beyond that initial hook to analyze what happens next. This lesson focuses on a core principle of the Reels algorithm: how watch time and completion rate influence reach. We'll dissect these two crucial metrics, understand their trade-offs, and learn how to use your own analytics to diagnose and improve them. For you, as a strategist aiming to build reliable systems for growth, mastering this is the key to creating content that doesn't just start strong but holds attention and earns its reach.
Part 1: The Two Pillars of Reel Performance
When the Instagram algorithm evaluates a Reel, it's essentially asking one question: "Is this content valuable enough to keep people on our platform?" It measures this value using two primary metrics related to viewing duration:
- Average Watch Time: The total number of seconds, on average, that a viewer spends watching your Reel.
- Completion Rate (or Watch Rate): The average percentage of your video that viewers finish.
Many creators mistakenly believe these are the same, but they measure different things, and the algorithm weighs them both. Let's start with the case for completion rate.
Instagram Algorithm Secrets: What I Learned from a Former Meta Engineer
This article, drawing insights from a former Meta engineer, makes a strong argument that completion rate is the single most important metric for the Instagram algorithm.
Please read the sections titled 'The 3-Second Rule That Changes Everything' and 'The One Metric That Rules Instagram.' Pay close attention to how completion rate is calculated and why a rate over 100% (from replays) is such a powerful positive signal.
The article highlights a critical point: a high completion rate is a direct signal of audience satisfaction. However, focusing only on completion rate would favor extremely short videos. Let's hear directly from the Head of Instagram, Adam Mosseri, to add crucial nuance to this discussion.
Head of INSTAGRAM reveals secrets to GROWING in 2026
While a high completion rate is vital, it's not the only factor. In this clip, Adam Mosseri clarifies the distinction between 'watch time' (total seconds) and 'watch rate' (completion percentage).
Please watch from 18:25 to 19:20. Notice how he explains that the algorithm looks at both metrics because it doesn't want to unfairly penalize longer content. The key is the 'overall amount of time watched'.
So, how do we reconcile these two ideas? A high completion rate is good, but so is high total watch time. This next resource provides the perfect synthesis.
Ideal Instagram Reels Length & Format for Retention
This blog post from OpusClip brilliantly explains the interplay between watch time and completion rate with a practical example.
Read the subsection titled 'The Data Behind Optimal Reel Duration.' The core concept is illustrated in this sentence: 'A 30-second Reel with 50% retention delivers 15 seconds of watch time per viewer, while a 10-second Reel with 80% retention delivers only 8 seconds.' This demonstrates why the longer Reel, despite a lower completion rate, might be judged as more valuable by the algorithm.
To summarize, you can think of it as a balance:
- Completion Rate signals the quality and satisfaction of the content.
- Average Watch Time signals the quantity of attention captured.
The algorithm's holy grail is a Reel that scores high on both—content that is long enough to accumulate significant watch time but so compelling that a high percentage of viewers stick around to finish it.
Part 2: The Strategic Choice of Reel Length
This balance between watch time and completion rate makes your choice of video length a key strategic decision, not just a creative one. Let's look at some data.
The "Instagram Algorithm Secrets" article (LINK) you read earlier contains data on how length directly affects completion rates. It states:
- Videos under 10 seconds can hit over 100% completion rates.
- 15-second videos get around 95%.
- 30-second videos drop to 65%.
- 60-second videos fall below 40%.
This data, combined with the "Ideal Instagram Reels Length & Format for Retention" article (LINK), gives us a clear strategic framework:
- 7-15 Seconds (Entertainment & Quick Tips): This is the sweet spot for maximizing completion rate. The video is so short that viewers easily finish it, and if it's clever, they might rewatch it (a "loop"), pushing your completion rate over 100%. This is ideal for trend-based content, quick visual gags, or a single powerful tip.
- 15-30 Seconds (Educational & Storytelling): This range is perfect for the kind of content you create for coaches and healthcare brands. It allows you to deliver substantial value—a mini-tutorial, a 3-step process, or a client testimonial. Your goal isn't a 100% completion rate, but to make a 25-second video so engaging that it achieves a 60-70% completion rate, resulting in a high average watch time (e.g., ~16 seconds). This often outperforms a 10-second video with 90% completion (9 seconds of watch time).
Your job as a strategist is to match the content's message to the optimal length, rather than forcing every idea into a 10-second format.
Part 3: How to Analyze and Improve Your Watch Metrics
Theory is useful, but execution is what matters. Your tool for this is the Audience Retention graph in your Instagram Insights.
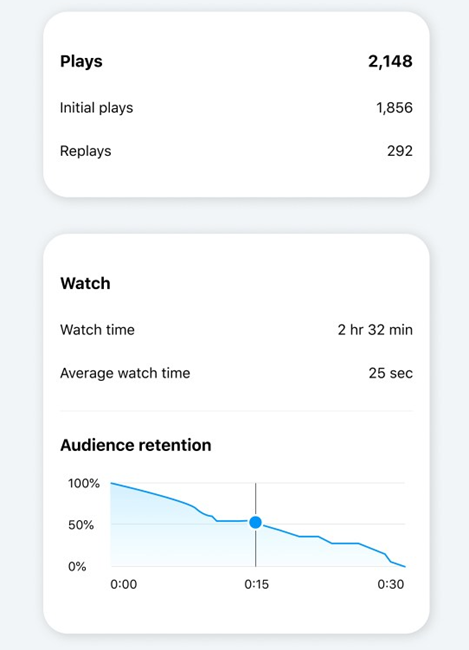
A flat line is the dream, but in reality, you will always see a downward slope. Your job is to make that slope as gentle as possible and to understand why the steep drops occur. Let's see a practical analysis in action.
If your Reels get under 10,000 Views… do this now!
This clip from the 'heyDominik' channel demonstrates how to read a retention graph to find and analyze the weak points in your content.
Watch the segment from 07:35 to 08:50. The speaker analyzes a sample retention graph, pointing out where he would investigate drop-offs, and connects this to other key metrics like average watch time.
Using this approach, you can become a detective of your own content. When you analyze a Reel, look for three key areas:
- The Initial Drop (0-3 seconds): This reflects your hook's effectiveness. A steep drop here means your opening failed to stop the scroll.
- Mid-Video Dips: A sudden cliff in the middle of your graph is a gift. Go to that exact timestamp in your video. What happened? Was it a slow moment? A confusing transition? Did you stop talking? This is a clear signal of what to avoid in the future.
- The Final Drop-off: If viewers leave right before the end, it suggests your conclusion lacked a payoff. You didn't answer the question you posed or deliver the promised value.
To systematically improve retention, focus on the format elements detailed in the "Ideal Instagram Reels Length & Format for Retention" article (LINK). The most impactful are:
- Hook Strength: A strong visual or verbal hook in the first 1.5 seconds.
- Pacing: A cut or visual change every 1.5-3 seconds to maintain energy.
- Captions: Clear, well-timed captions for the ~85% of users who watch with sound off.
- Seamless Loops: For short videos, making the end flow perfectly back to the beginning encourages replays and boosts your metrics.
Conclusion
Today, we've dissected the engine room of the Reels algorithm. You now have a sophisticated understanding of how Instagram measures and rewards content that holds audience attention.
Key Takeaways:
- Reel reach is profoundly influenced by a balance of Average Watch Time and Completion Rate.
- Longer videos with a good completion rate can outperform shorter videos with a great one because they accumulate more total watch time.
- Reel length is a strategic decision. Match your content's purpose to the optimal length (e.g., 15-30 seconds for educational content) to maximize its algorithmic potential.
- The Audience Retention Graph is your most important diagnostic tool. Use it to identify and eliminate the exact moments where your content is losing viewers.
Preview of the next lesson:
We have now covered the most important mechanical signals that drive the algorithm: engagement velocity, watch time, and completion rate. But mechanics are only half the battle. What makes someone want to watch a video to completion or share it with a friend? In our next lesson, we will transition from the algorithm to the audience, exploring the psychological triggers (like identity, emotion, and utility) that drive viral sharing behavior.