Introduction
In our last lesson, we focused on the Kaplan-Meier estimator, a method for directly estimating the survival function from data that may include censored observations. We saw how this estimator is constructed as a product of conditional survival probabilities. Today, we will explore a different, yet closely related, non-parametric method: the Nelson-Aalen (NA) estimator.
This lesson will teach you how to construct and compute the Nelson-Aalen estimate. Instead of targeting the survival function directly, this approach first estimates the cumulative hazard function, . As you know from our earlier discussions on survival models, and are fundamentally linked by the relationship . By estimating the cumulative hazard, we gain another powerful way to understand and quantify survival patterns, which can then be used to estimate the survival function itself.
From Survival Products to Hazard Sums
Recall that the Kaplan-Meier estimator is multiplicative. It estimates survival by multiplying probabilities of surviving past each event time:
where is the number of events (deaths) at time and is the number of individuals at risk just before that time.
The Nelson-Aalen approach is, by contrast, additive. It operates on the principle that the instantaneous hazard rate at an event time can be estimated by the proportion of the risk set that experiences the event, i.e., . The cumulative hazard is the sum (or integral, in the continuous case) of these hazard rates over time. The NA estimator builds the cumulative hazard function by simply summing these discrete hazard contributions.
This conceptual shift from a product of probabilities to a sum of hazards provides a different perspective on the same underlying data.
The Nelson-Aalen Estimator: Formula and Calculation
The formal definition of the Nelson-Aalen estimator is straightforward. It starts at zero, , and increases at each event time. The following reading from your core actuarial study manual introduces the formula and provides a worked example.
[PDF] Contents - ACTEX Mad River
This section from the ASM study manual provides a concise introduction to the Nelson-Aalen estimator, explaining its intuition and giving the core formula.
Please read the subsection "24.2 Nelson-Åalen Estimator". Focus on understanding the formula for \hat{H}(t), the logic illustrated in Figure 24.3, and how to apply it in Example 24F. Pay close attention to how the risk set n_j (denoted r_j in the text) is calculated, as the principle is identical to the one we used for the Kaplan-Meier estimator.
As the reading makes clear, the formula is:
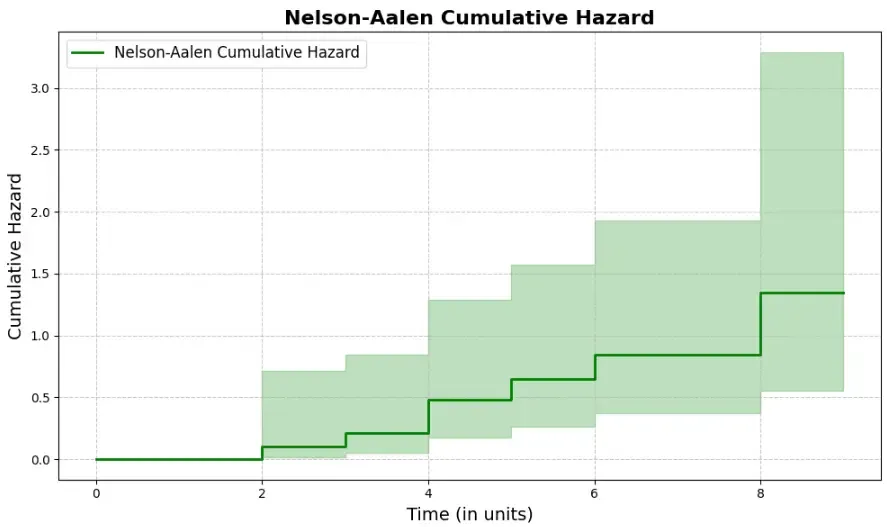
Visually, this produces a right-continuous step function. It is constant between events and jumps upwards at each event time by an amount equal to the estimated hazard, .
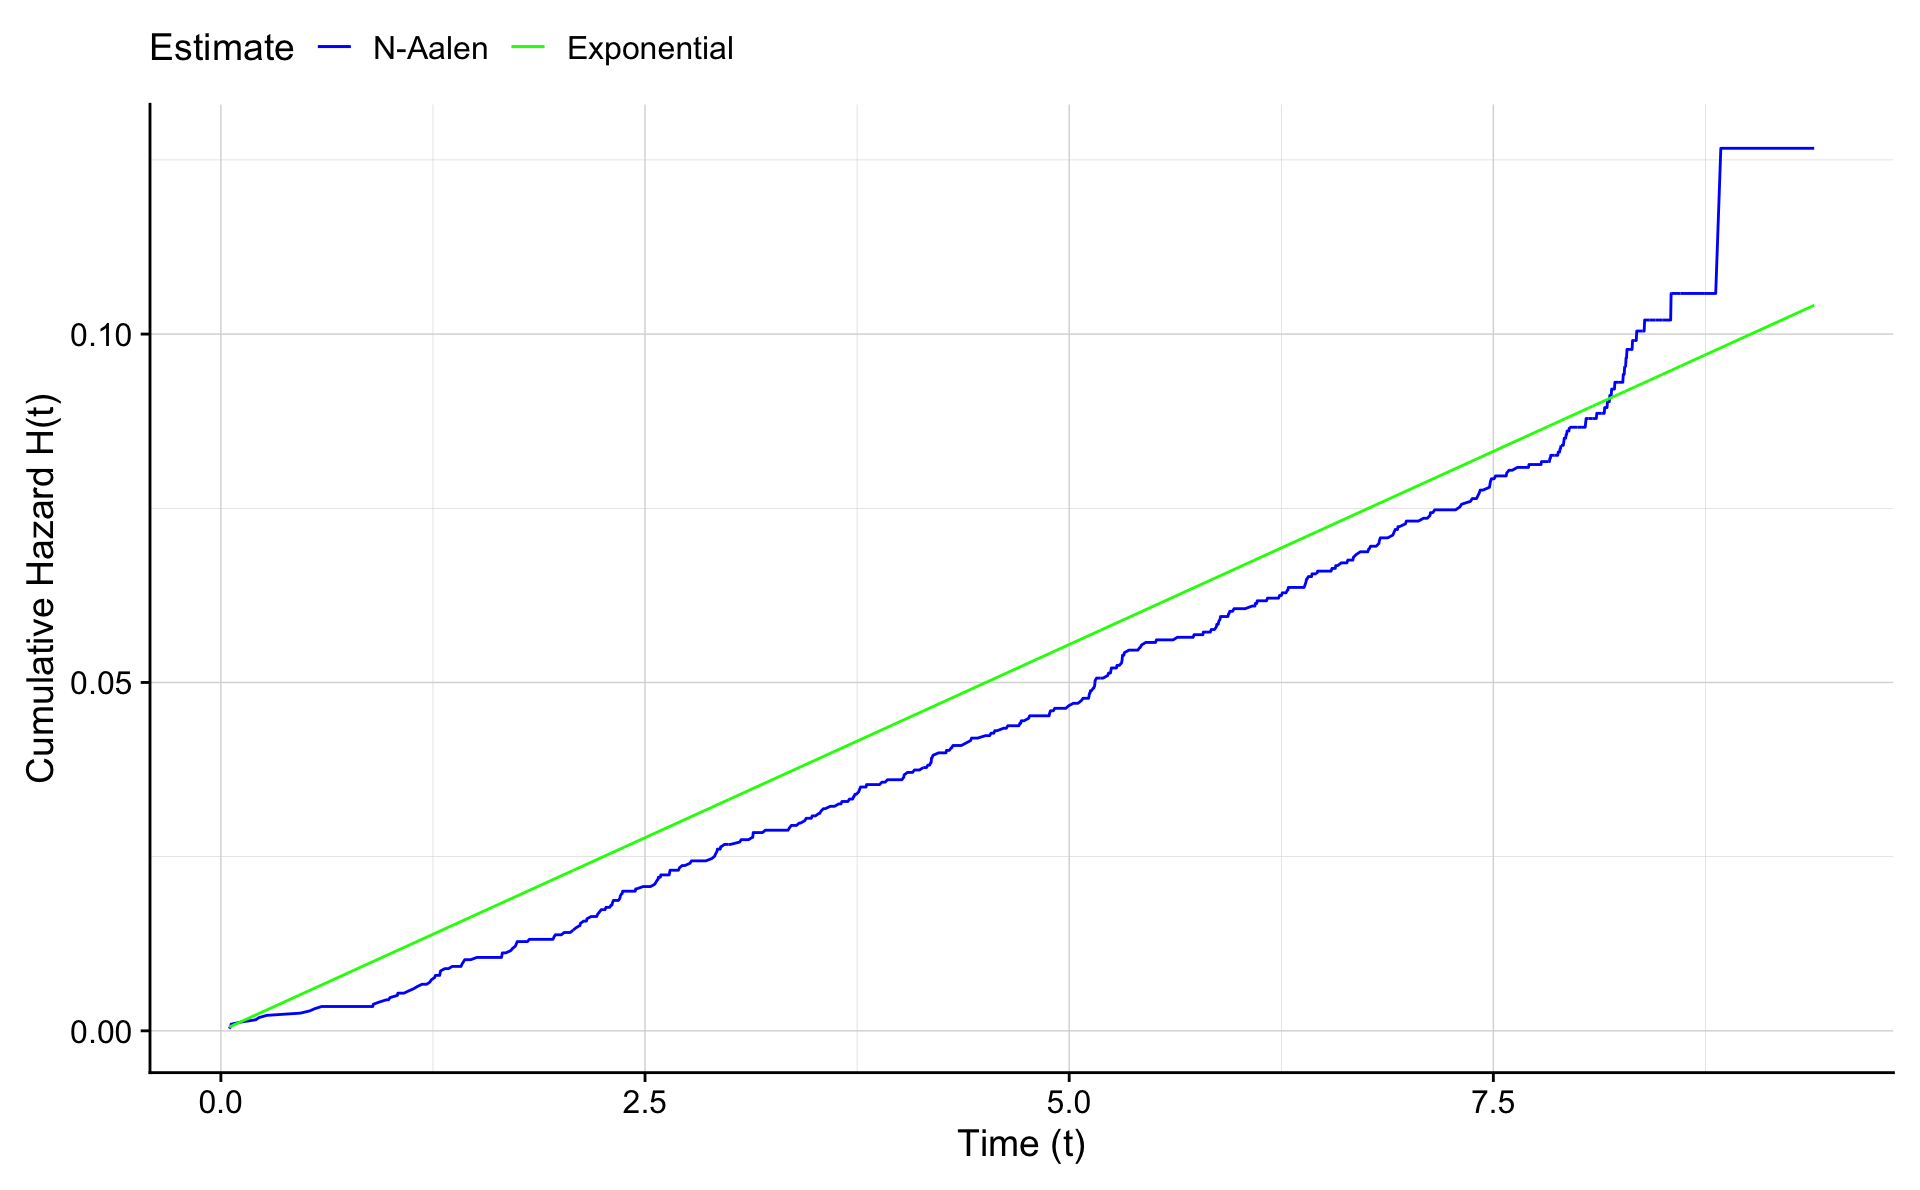
This non-parametric, data-driven step function can be contrasted with the smooth, pre-defined shape of a parametric cumulative hazard function, such as the straight line that arises from an exponential survival model.
A Worked Example
Let's apply the formula to a small dataset to ensure the calculation is clear.
Suppose we start a study with 5 individuals. The observed times are: 2, 5, 5+, 8, 9+. The '+' indicates a right-censored observation.
The event times are and .
-
At time :
- The number at risk, , is all 5 individuals.
- The number of events, , is 1.
- The cumulative hazard is .
- For any time where , .
-
At time :
- To find the number at risk, , we start with the 5 individuals, subtract the 1 who had an event at , and subtract the 1 who was censored at . So, .
- The number of events, , is 1.
- The cumulative hazard is incremented:
- For any time (until the next event), .
Practice Problem
Now, let's try a typical exam-style problem that requires you to work backwards, testing your understanding of the estimator's sequential construction.
[PDF] SOA/CAS Exam C Sample Questions - Casualty Actuarial Society
This problem from a past professional exam sample tests your understanding of the cumulative nature of the Nelson-Aalen estimator.
Read question 33 on page 19: Question 33. Before looking at any solutions, try to solve it yourself. Think about how \hat{H}(t) is built up sequentially from the initial number of individuals in the study.
Solution Walkthrough:
The problem states the data were not truncated or censored and at most one claim was paid at any one time (i.e., all ). Let be the initial number of claims.
The NA estimate after the second claim is:
We need to find . We can solve the quadratic, but given your background, you might quickly estimate that the two terms are roughly equal, so , which gives . This suggests . Let's check:
The value is correct.
Now we need the estimate immediately following the fourth paid claim. We just continue the summation:
This corresponds to answer choice (C).
Connecting Nelson-Aalen back to Survival
The primary output of the NA estimator is the cumulative hazard, but we can easily derive a survival function estimate using . This is sometimes called the Fleming-Harrington estimator.
An interesting theoretical point arises when comparing this NA-derived survival estimate with the Kaplan-Meier estimate. For any dataset, it can be shown that:
The estimates are very close, but the NA-derived survival probability is always slightly higher (more optimistic) than the direct KM estimate. This is because the KM estimator uses the term , while the NA approach effectively uses . From the series expansion of the exponential function, we know that for any . This subtle difference is a direct consequence of the additive versus multiplicative approaches.
Conclusion
In this lesson, we have added the Nelson-Aalen estimator to your non-parametric modeling toolkit. It provides a direct way to estimate and visualize the cumulative hazard from potentially censored data.
Key Takeaways:
- The Nelson-Aalen estimator is a non-parametric method for estimating the cumulative hazard function, .
- The estimate is calculated as an additive sum of the hazard contributions at each event time: .
- Like the Kaplan-Meier survival curve, the NA estimate for is a right-continuous step function.
- A corresponding survival function estimate can be obtained via the relationship .
Having learned two distinct methods for analyzing survival in a single population, our next step is to address a fundamental question in research: how do we compare survival between different groups? In the next lesson, we will introduce the log-rank test, a widely used statistical test for formally comparing two or more survival curves.