Introduction
In our last lesson, we explored parametric graduation, a method where we fit a rigid mathematical formula like the Gompertz or Makeham law to our crude mortality data. This approach is powerful but has a significant limitation: it forces the mortality curve into a predefined shape that may not accurately capture the true underlying pattern, especially if it's complex.
Today, we will investigate a more flexible technique: graduation by reference to a standard table. Instead of building a mortality curve from scratch, this method involves taking a well-established, smooth mortality table from a large population and adjusting it to fit our specific dataset. For you as a statistician, this is conceptually similar to transfer learning, where a pre-trained model is fine-tuned on a new, smaller dataset. We leverage the robustness of the standard table while still capturing the unique characteristics of our own data. This lesson will equip you to select appropriate standard tables, define the mathematical links between them and your data, and estimate the necessary parameters.
The Rationale for Graduating by Reference
Populations often share a similar shape of mortality, even if the overall level of mortality differs. For instance, a group of insured individuals and the general population both experience mortality rates that are low at young ages, rise slightly in early adulthood, and then increase exponentially at older ages. However, the insured group might have consistently lower mortality at every age.
Graduation by reference leverages this idea. We start with a "standard table"—a mortality table based on a large, reliable dataset like a national census or a massive insurance portfolio—and assume our population's true mortality rates can be expressed as a simple transformation of the rates in that standard table.
This approach is particularly useful when:
- Our own dataset is small or sparse, leading to volatile crude rates.
- We lack sufficient data at very young or very old ages.
- We believe the underlying mortality pattern of our group is similar in shape to a larger, well-documented population.
The general process involves three steps:
- Select a standard table that is a plausible baseline for the population being studied.
- Propose a linking function that mathematically connects the mortality rates of the standard table to the rates of our population.
- Estimate the parameters of this linking function using the observed data (deaths and exposures), typically via maximum likelihood estimation.
Linking Functions: The Bridge Between Tables
The linking function defines the mathematical relationship between our graduated force of mortality, , and the force of mortality from the standard table, . The choice of function depends on how we believe our population's mortality deviates from the standard.
Some common linking functions include:
-
A constant scaling factor:
This is the simplest model, assuming our population's mortality is just a fixed percentage of the standard table's mortality across all ages.
-
A linear transformation:
This provides more flexibility, allowing for both a multiplicative () and an additive () adjustment.
-
An age-dependent scaling factor:
This sophisticated model allows the relationship to change with age. For example, the mortality advantage of a certain group might diminish as they get older, a feature this model can capture.
-
An exponential adjustment:
This is a very common and effective model. By taking logarithms, the relationship becomes linear: . This implies that the log difference in mortality between the two populations is a linear function of age.
The following reading discusses some of these simple adjustments in a practical context.
[PDF] Graduating mortality base tables Theory and practice (part 1)
This presentation from the Institute and Faculty of Actuaries discusses alternatives to full graduation, which are essentially simple forms of graduation by reference.
Please read the slide titled "Alternatives to graduation". Pay attention to the descriptions of Flat scaling (our constant scaling factor model) and Structured scaling (similar to our age-dependent scaling model). This shows how these methods are used in actuarial practice.
A Practical Case Study: Choosing the Best Model
Once we have our candidate standard tables and linking functions, how do we select the best combination? As in the previous lesson, we fit each model using Maximum Likelihood Estimation (assuming Poisson-distributed deaths) and then compare them using statistical criteria like AIC, BIC, or simply the maximized log-likelihood value.
The following thesis provides a complete, real-world example of this process for an insurance portfolio.
[PDF] MASTER ACTUARIAL SCIENCE MASTER'S FINAL WORK
This master's thesis demonstrates the process of graduating a life insurance portfolio's mortality data by referencing standard tables.
First, read the section Graduation by reference (part of section 2.2.1). This formalizes the process we've just discussed, defining the linking function and the parameter estimation goal. Next, read section 4.1.1, Graduation with reference tables. This is the core of our case study. Observe: The standard tables chosen for comparison (GKM80, GKM95, etc.). The three linking functions tested, including linear and exponential forms. Table III, which presents the results. Notice how the author uses the log-likelihood and other error measures (MSE, WSS) to determine the best-fitting model. In this case, the GKM80 table with an exponential adjustment (link 3) is identified as the winner due to the highest log-likelihood and lowest error metrics.
This case study perfectly illustrates the graduation-by-reference workflow: proposing multiple models, fitting them to data, and using statistical evidence to select the most appropriate one.
A Broader Perspective: Direct and Indirect Standardization
The methods we are discussing are part of a wider family of techniques known as standardization, which are central to epidemiology and public health for making fair comparisons between populations with different structures (e.g., different age distributions). The two main approaches are indirect and direct standardization.
The following video provides an excellent and clear explanation of both concepts.
Age standardised mortality rate
This video from the "Global Health with Greg Martin" channel clearly explains the principles of age standardization.
First, watch the segment on indirect age standardization from the explanation. Here, you'll learn about the Standardised Mortality Ratio (SMR). This is calculated by: Taking your study population's age structure (exposures). Applying the age-specific mortality rates from a standard population to get the expected number of deaths. Calculating the ratio of observed deaths to expected deaths: SMR = Observed / Expected. An SMR of 1.2, for example, means the study population experienced 20% more deaths than would be expected if it had the same mortality rates as the standard population. Next, watch the segment on direct age standardization from the explanation. This method involves: Taking the age-specific mortality rates from your study populations. Applying them to a single standard population structure. This yields age-adjusted mortality rates for each study population that are directly comparable because the confounding effect of age structure has been removed.
The graduation-by-reference technique we have focused on is a sophisticated form of direct standardization. We are essentially creating an age-adjusted mortality table for our population by "borrowing" the smooth age pattern from a standard table.
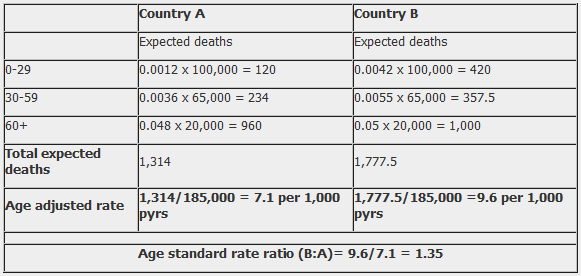
The image below shows a simple calculation of an age-adjusted rate and an age-standardized rate ratio, which is a comparison of these adjusted rates (e.g., Country B's rate / Country A's rate). This exemplifies the direct method described in the video.
Conclusion
In this lesson, we have added a crucial and flexible tool to our graduation toolkit. Parametric formulas are powerful when a known law of mortality applies, but graduating by reference to a standard table offers a practical and robust alternative when data is sparse or the underlying mortality pattern is less certain.
Key Takeaways:
- Graduation by Reference: This method adjusts a pre-existing, reliable standard mortality table to fit the observed data of a smaller population.
- Process: It involves selecting a standard table, defining a mathematical linking function, and estimating the function's parameters using Maximum Likelihood Estimation.
- Linking Functions: Common forms include constant scaling, linear transformations, and exponential adjustments, which offer varying degrees of flexibility.
- Model Selection: The best combination of standard table and linking function is chosen by comparing statistical metrics like AIC, BIC, and log-likelihood across different models.
- Standardization Context: This technique is a form of direct standardization, a method used to create comparable rates by removing the confounding effect of population structure. The related concept of indirect standardization yields the Standardised Mortality Ratio (SMR), a single summary measure of relative mortality risk.
Preview of the Next Lesson
We have now covered parametric methods and semi-parametric methods (by reference). What if we want even more flexibility and wish to let the data "speak for itself" as much as possible? In our next lesson, we will explore graphical and spline-based methods. These techniques impose even fewer structural assumptions, aiming to produce a smooth curve that follows the data's contours very closely, a process that relies heavily on visual judgment and non-parametric smoothing techniques.