Introduction
In our last lesson, we delved into the specifics of evaluating distinct model capabilities, learning how to precisely measure factual accuracy, reasoning, and instruction-following. This granular analysis is essential for diagnosing model weaknesses, but it's only one piece of the puzzle. An elite engineer must not only determine if a model is "good" but also if it is the right choice for the business, considering real-world constraints like budgets and user experience.
Today, we will synthesize everything from this module to address the final, crucial step in evaluation: making a data-driven decision. This lesson directly tackles the learning outcome: Create a decision matrix to compare LLMs based on a weighted combination of performance, cost, latency, and safety. You will learn to construct a systematic framework that balances technical performance with operational and business realities, a skill that is indispensable when justifying technology choices and designing production-ready AI systems.
1. From Business Goals to Evaluation Criteria
Before you can compare models, you must first define the axes of comparison. A common mistake is to over-index on a single performance benchmark while ignoring the factors that determine a project's success in production. The first step is always to translate business objectives into a set of measurable criteria.
The LLM Benchmarking Guide Every AI Team Needs
This article, 'The LLM Benchmarking Guide Every AI Team Needs' from Galileo AI, provides an excellent enterprise-level perspective on this process. We'll start by focusing on how to define what 'good' means for your project.
Read the first section, 'LLM benchmarking step #1: Clarify your use-case and success criteria'. Pay close attention to how it connects concrete business objectives to measurable outcomes and identifies the core pillars of evaluation.
As the article highlights, your decision framework must be built on clear, stakeholder-approved criteria. For most enterprise use cases, these can be grouped into four essential pillars:
-
Performance & Quality: This is a direct measure of how well the model accomplishes its task. The metrics here come from the evaluations we've discussed throughout this module:
- Academic Benchmarks: Scores on MMLU, GSM8K, HumanEval, etc., which provide a general sense of capability.
- Custom Evals: Domain-specific scores for factuality, reasoning, instruction-following, and relevance, generated using techniques like LLM-as-a-judge or programmatic checks. This is often the most important performance signal.
-
Cost: This encompasses the total financial impact of using the model.
- API-based Models: Typically measured in cost per million tokens (input and output).
- Open-Source Models: Includes inference hardware costs (CapEx or OpEx), infrastructure maintenance, and engineering time. Don't forget to model the cost per request to have a comparable metric.
-
Latency: This measures the speed of the model, which is critical for user experience.
- Average Response Time: The total time from sending a request to receiving the full response.
- Time To First Token (TTFT): For streaming applications, how quickly the user starts seeing output.
-
Safety & Compliance: This pillar covers operational and regulatory risks.
- Data Privacy: Can the model be run in your own environment (like an open-source model), or does data get sent to a third-party vendor?
- Alignment & Safety: How well does the model adhere to safety guardrails? Is it prone to generating harmful, biased, or inappropriate content?
- License Restrictions: Does the model's license permit commercial use?
By defining these pillars upfront, you create a comprehensive and defensible basis for your comparison.
2. Building the Decision Matrix: The Weighted Scoring Model
Once you have your criteria, you need a systematic way to combine them. A weighted decision matrix (or weighted scoring model) is a powerful tool for this. It allows you to formalize the trade-offs between your criteria based on business priorities.
To understand the mechanics, let's watch a short, clear explanation of how these models work.
Problem-Solving Techniques #13: Weighted Scoring Model
This video from Eugene O'Loughlin provides a concise introduction to the weighted scoring model, a general-purpose decision-making tool that we will apply to LLM selection.
Watch the segments from 00:01:03 to 00:03:28 and from 00:05:11 to 00:05:32. Focus on these three steps: Assigning Weights: How do you distribute 100% of importance across your criteria? Scoring Options: How do you give each option a score for a specific criterion? Calculating the Total: Understand the simple formula: Total Score = Σ (Weight * Score).
Now, let's apply this directly to LLM selection. The process is:
Step 1: Assign Weights to Criteria
This is the most critical step and requires aligning with business stakeholders. The weights reflect the project's priorities. For a real-time customer-facing chatbot, the weights might be: Latency (40%), Performance (30%), Cost (20%), Safety (10%). For an offline document analysis tool, it might be: Performance (50%), Cost (30%), Safety (20%), Latency (0%).
Step 2: Score Each Model Against Each Criterion
You must normalize your raw measurements onto a common scale (e.g., 1-10).
- For Performance: You can use the direct score if it's already on a scale (e.g., 85% accuracy = 8.5/10), or rank models.
- For Cost & Latency: Lower is better. You can invert the scale. For example, if you have models with latencies of 200ms, 500ms, and 1000ms, you could assign scores of 10, 5, and 2 respectively.
- For Safety & Compliance: This is often a qualitative score based on features (e.g., "Can be self-hosted" = 10/10 for data privacy, "API only" = 3/10).
Step 3: Calculate the Weighted Score
For each model, multiply the score for each criterion by its weight, and sum the results.
Example Decision Matrix
Let's imagine we're selecting an LLM for a financial Q&A bot. Priorities are high accuracy, data privacy, and moderate speed.
| Criteria | Weight | Model A (GPT-4 Class) | Model B (LLaMA 3 70B Class) | Model C (Mistral 7B Class) |
|---|---|---|---|---|
| Score (1-10) | Score (1-10) | Score (1-10) | ||
| Performance (Factuality on finance data) | 40% | 9.5 | 8.5 | 7.0 |
| Cost ($/1M tokens, normalized) | 20% | 3.0 | 8.0 | 9.5 |
| Latency (Response time, normalized) | 15% | 4.0 | 7.0 | 9.0 |
| Safety (Data Privacy: Self-hostable?) | 25% | 2.0 | 9.0 | 9.0 |
| TOTAL | 100% | ? | ? | ? |
Let's calculate the scores:
- Model A:
(9.5 * 0.4) + (3.0 * 0.2) + (4.0 * 0.15) + (2.0 * 0.25) = 3.8 + 0.6 + 0.6 + 0.5 = **5.5** - Model B:
(8.5 * 0.4) + (8.0 * 0.2) + (7.0 * 0.15) + (9.0 * 0.25) = 3.4 + 1.6 + 1.05 + 2.25 = **8.3** - Model C:
(7.0 * 0.4) + (9.5 * 0.2) + (9.0 * 0.15) + (9.0 * 0.25) = 2.8 + 1.9 + 1.35 + 2.25 = **8.3**
In this scenario, Models B and C are tied with the highest weighted score, making them far better choices for this specific use case than the powerful but expensive and less private Model A. The choice between B and C would then depend on the trade-off between B's higher performance and C's better cost and latency.

3. Beyond the Matrix: Visualizing Trade-offs and Making the Call
The final score is a guide, not a gospel. An expert engineer uses this quantitative output to inform a final, qualitative decision.
The Pareto Frontier
One of the best ways to visualize trade-offs is by plotting models on a 2D chart. A common and highly effective visualization is plotting Performance vs. Cost.
Stanford CME295 Transformers & LLMs | Autumn 2025 | Lecture 8 - LLM Evaluation
The Stanford lecture on LLM Evaluation introduces this concept as the 'Pareto Frontier'. Understanding this will allow you to present your findings to stakeholders in a very intuitive way.
Watch the clip from 01:47:30 to 01:48:30. Focus on how the plot of Performance vs. Price helps identify the models that offer the best 'bang for your buck'. The models on the edge of this plot form the Pareto frontier.
The Pareto frontier consists of all models for which you cannot improve on one dimension (e.g., performance) without getting worse on another (e.g., cost). Any model not on the frontier is "sub-optimal" because there is another model that is both better and cheaper. Your selection should almost always come from a model on this frontier.
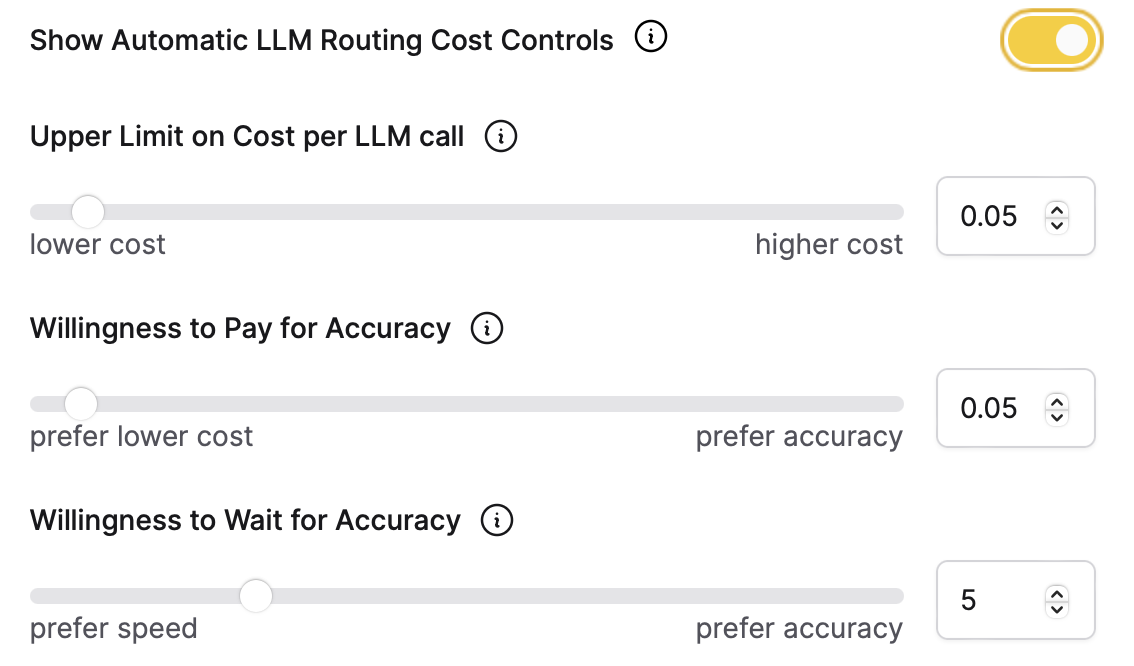
From Abstract Weights to Real-World Controls
The weightings in your matrix are not just a theoretical exercise. In sophisticated LLM applications and orchestration platforms, these trade-offs can be implemented as dynamic routing rules.
Making the Final Decision
Your analysis culminates in a recommendation. As the Galileo guide points out, this involves creating a final side-by-side comparison and considering qualitative factors.
The LLM Benchmarking Guide Every AI Team Needs
Let's return to the 'LLM Benchmarking Guide' to see how to wrap up the process.
Read the sections 'Analyze results and stress-test edge cases' and 'Decide, deploy, and plan continuous benchmarking'. Note the emphasis on using the weighted composite scores but also considering qualitative notes as a tiebreaker and creating a final comparison table.
If Models B and C are tied in our example, your qualitative notes might be the decider. Perhaps Model B has better documentation and an active community for fine-tuning support, making it the superior choice despite being slightly more expensive than Model C. Your final recommendation should clearly state the winning model and the data-driven reasoning behind the choice, referencing both the weighted score and these crucial tie-breaking factors.
Test your understanding!
You are choosing an LLM for an internal code generation assistant. The key business goals are:
- High-quality code: The model must be strong at coding tasks (Performance).
- Fast suggestions: The tool must feel responsive to developers (Latency).
- Cost-effective: The company has a limited budget (Cost).
- No sensitive code should leave the company's servers (Safety/Compliance).
You have evaluated three models:
- Model X (Cloud API): Performance (HumanEval score) = 92%, Latency = 800ms, Cost = $10/M tokens, Safety = API-based.
- Model Y (Self-hosted 34B): Performance = 85%, Latency = 1200ms, Cost = $2/M tokens (estimated infra cost), Safety = Self-hosted.
- Model Z (Self-hosted 7B): Performance = 75%, Latency = 400ms, Cost = $0.5/M tokens (estimated infra cost), Safety = Self-hosted.
Based on the business goals, assign weights to the four criteria (Performance, Latency, Cost, Safety). Then, briefly justify which model you would choose and why, based on a rough application of the decision matrix logic.
Show answer
1. Assigning Weights:
Based on the business goals, a reasonable weighting would be:
- Safety (40%): The requirement that no code leaves the servers is a hard, non-negotiable constraint. This should have the highest weight.
- Performance (30%): The quality of the code is the primary function, making it the next most important factor.
- Latency (20%): Responsiveness is important for user experience.
- Cost (10%): While a factor, it's listed last among the priorities.
2. Justification and Model Choice:
First, we can immediately disqualify Model X. Despite its top performance, its Safety score would be extremely low (perhaps 1/10) because it's API-based and violates the core security requirement. Its weighted score would be non-competitive regardless of its other merits.
Now we compare Model Y and Model Z.
- Model Y is the high-performance self-hosted option. It excels in
Performance(8.5/10) but is weaker onLatency(slowest) andCost(more expensive to run). - Model Z is the speed-and-cost champion. It has excellent
Latency(10/10) andCost(10/10) but has significantly lowerPerformance(7.5/10).
The choice depends on the trade-off between performance and latency. Given the weights (Performance 30%, Latency 20%), the 10-point performance gap between Model Y and Model Z is likely more impactful than the latency difference.
A quick calculation:
- Model Y's Perf/Latency contribution:
(8.5 * 0.3) + (say, 4/10 * 0.2) = 2.55 + 0.8 = 3.35 - Model Z's Perf/Latency contribution:
(7.5 * 0.3) + (say, 10/10 * 0.2) = 2.25 + 2.0 = 4.25
In this case, Model Z's huge advantage in latency and cost might actually give it a higher total score, making it the better choice if its 75% performance is "good enough" for the developers. If the 75% performance is too low to be useful, then Model Y would be the only viable choice, and the business would have to accept the higher latency and cost.
This demonstrates how the matrix clarifies the exact trade-offs you are making. A good recommendation would present both options and state: "Model Z is the optimal choice for speed and cost, but if its baseline code quality is insufficient, we must choose Model Y and accept a 3x increase in response time and 4x increase in cost."
Conclusion
You have now reached the culmination of our module on LLM evaluation. You've progressed from understanding individual metrics to designing comprehensive evaluation suites and, finally, to synthesizing all available data into a strategic business decision.
Key Takeaways:
- A decision matrix is a crucial tool for making a rational, evidence-based choice between LLMs.
- The process involves four steps: defining criteria (Performance, Cost, Latency, Safety), assigning weights based on business priorities, scoring models on a normalized scale, and calculating a final weighted score.
- Raw scores from the matrix should be supplemented with qualitative analysis and visualizations like the Pareto frontier to understand efficiency trade-offs.
- This framework provides the structure and data needed to confidently recommend a specific model and justify that choice to both technical and business stakeholders.
What's Next?
With this lesson, you have completed the "LLM Evaluation Frameworks and Practices" module. You are now equipped with an end-to-end toolkit for selecting the best possible foundation model for any given task.
The logical next step is to learn how to adapt and specialize that chosen model. In our next module, "Adapting LLMs: Fine-Tuning and Alignment," we will explore the powerful techniques used to customize a pre-trained model for your specific domain. We'll begin by explaining the critical differences between full fine-tuning and modern, highly efficient methods like PEFT and QLoRA.