Introduction
In our previous lesson, we examined how exchange rate movements create predictable headwinds and tailwinds for different sectors based on their import and export exposure. We concluded by noting that a key vulnerability for an importer like India is its reliance on foreign crude oil. A weakening rupee makes every barrel more expensive. This naturally leads to the next critical question for any market operator: what drives the price of the barrel itself?
This lesson addresses that question by diving into the world of commodity cycles. These are the powerful boom-and-bust waves that characterize the prices of raw materials like oil, metals, and agricultural products. Far from being random noise, these cycles are a fundamental engine of the global economy. They dictate corporate profits, drive sector rotation, and are a primary source of inflation. Your goal is to understand the mechanics of these cycles—how they are born, how they ripple through the market, and how to use this knowledge to identify a clear set of winners and losers.
The Anatomy of a Commodity Cycle
Commodities are the basic goods used in commerce that are interchangeable with other goods of the same type. Think of crude oil, copper, iron ore, wheat, and coffee. The companies that produce these materials—miners, drillers, farmers—are largely price takers. Unlike a company like Apple, which sets the price for its iPhone, an oil company must sell its crude at the prevailing market price. This single fact makes their fortunes inextricably tied to the commodity's price cycle.
These cycles are not random. They are driven by a fundamental and recurring mismatch between supply and demand, often exacerbated by long lead times for new production. The pattern is classic:
- Demand exceeds supply: Prices rise.
- High prices incentivize investment: Companies pour capital into finding new oil fields, opening new mines, or planting more crops.
- A long lag: It takes years to bring a new deep-sea oil well or a massive copper mine online.
- Supply floods the market: All the new projects start producing at once, creating a glut.
- Prices crash: The glut of supply overwhelms demand.
- Underinvestment: With low prices, companies slash investment and may even shut down high-cost operations.
- Supply tightens: Production declines, setting the stage for the next shortage.
- The cycle repeats.
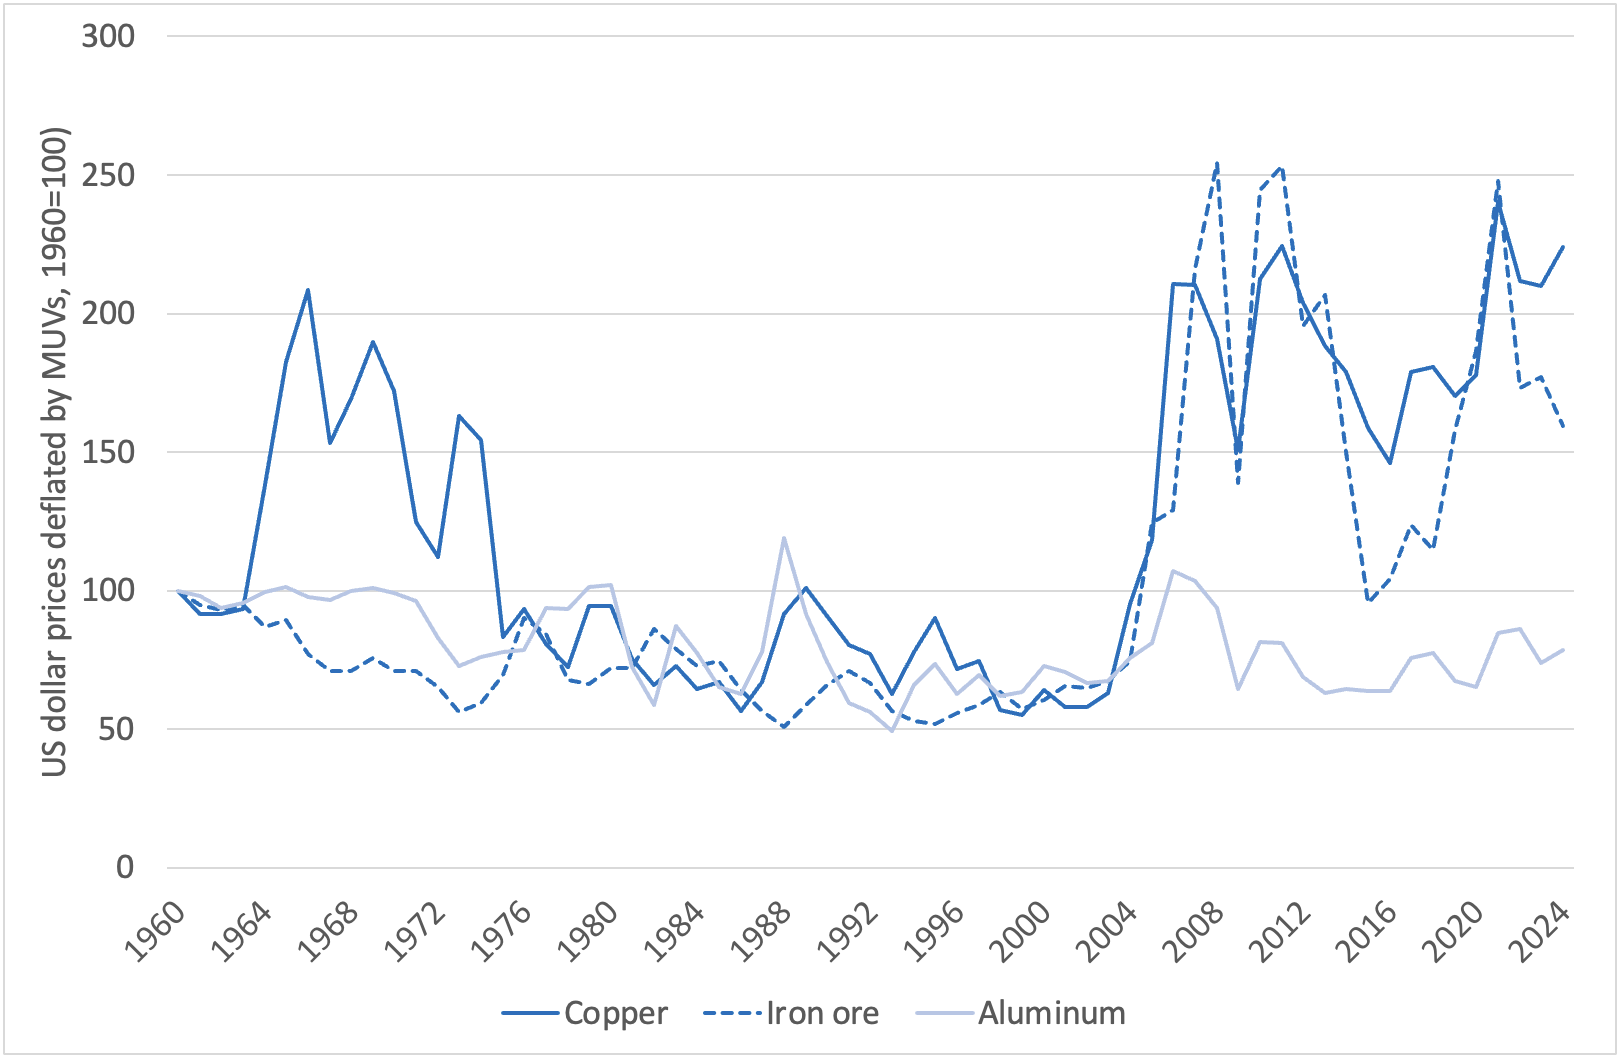
This volatile, cyclical behavior is a defining characteristic of commodity markets, as you can see in the historical prices of key industrial metals.
To truly grasp how these cycles impact companies, we'll turn to a foundational paper by Professor Aswath Damodaran, one of the world's leading experts on valuation.
[PDF] Valuing Cyclical and Commodity Companies
This paper explains the core challenges and characteristics of companies whose fortunes are tied to macro cycles. It's essential reading for developing a rigorous mental model.
Start by reading the abstract and the introduction to understand the core problem. Then, read the subsection "Commodity Companies" to see how they are defined. Finally, focus on the section titled "Characteristics," paying close attention to points 1 ("The...Commodity price cycle") and 2 ("Volatile earnings and cash flows"). These sections explain why commodity producers are price takers and how their high fixed costs amplify the effect of price changes on profits.
The key takeaway from Damodaran's work is that commodity companies have high operating leverage. Their costs (running a mine, operating an oil rig) are largely fixed. Therefore, when the price of the commodity they sell rises, that extra revenue flows almost directly to operating profit, causing an explosive expansion in margins. The reverse is also true during a price crash.
The Ripple Effect: From the Oil Well to the Supermarket Shelf
Let's use an oil price shock as a case study to trace how these cycles ripple through the entire economy. A sharp rise in the price of crude oil sets off a chain reaction.
What Stocks to Buy Amid Rising Oil Prices?
This video provides an excellent, practical walkthrough of how an oil price shock spreads through various sectors of an economy. While the examples are from the Philippines, the economic principles are universal.
Watch from the beginning to understand the initial chain reaction where rising oil prices lead to inflation. Then, observe how the video analyzes the direct impact on three key sectors: Airlines, which are hit by soaring jet fuel costs (watch this segment). Consumer companies, which face rising costs for oil-derived raw materials (watch this segment). Property developers, which see construction and logistics costs increase (watch this segment).
This sequence illustrates the transmission mechanism perfectly:
-
First-Order Effect (Producers): The immediate winners are the oil and gas producers themselves. Their revenues soar while their extraction costs remain relatively stable. Their stock prices often move in lockstep with the price of oil.
-
Second-Order Effect (Direct Consumers): The first losers are companies for whom oil is a primary and unavoidable input cost. Airlines are the classic example; jet fuel can account for 25-30% of their operating expenses. As the video shows, their margins get squeezed, and they must either absorb the cost or risk destroying demand by raising ticket prices too much. This group also includes chemical companies, plastics manufacturers, and shipping companies.
-
Third-Order Effect (Indirect Consumers & Broader Economy): The ripples spread further.
- Agriculture & Food: Higher energy prices increase the cost of fertilizer (produced using natural gas) and fuel for farm equipment and transport, raising food production costs.
- Construction: Costs for asphalt, machinery operation, and transporting heavy materials all rise.
- General Inflation: As transportation costs rise for every physical good, from electronics to clothing, the price increases are passed on to the end consumer, contributing to economy-wide inflation.
A Sector-Level Playbook
Having seen the mechanics, we can create a clear playbook for which sectors tend to win and lose during a commodity boom. Research from asset managers like State Street Global Advisors quantifies these relationships, confirming our intuition with data.
How macroeconomic variables impact sector performance
This research report provides a data-driven look at which sectors are most sensitive to macro variables, including oil prices.
First, examine Figure 3, the table titled "Sectors with strong relationships to macro variables." Look specifically at the "Oil" column to see the sectors with the strongest positive and negative correlations. Then, read the bullet points under the heading "Macro variables’ impact on sectors aligns with intuition," which explain the economic reasoning behind these statistical relationships.
Based on this analysis, we can generalize the winners and losers:
-
Winners from Rising Commodity Prices (Positive Correlation):
- Energy: The most direct beneficiary. Includes oil & gas exploration, production, and services companies.
- Materials: This sector includes miners of industrial and precious metals, as well as chemical companies. Commodity prices are their revenue source.
-
Losers from Rising Commodity Prices (Negative Correlation):
- Industrials (e.g., Airlines): Face higher fuel and raw material costs.
- Consumer Discretionary (e.g., Autos): Hit by higher input costs (steel, aluminum, plastic) and by weaker consumer spending if inflation erodes purchasing power.
- Utilities: Some utilities that rely on natural gas or coal for power generation see their input costs rise.
- Consumer Staples & Health Care: While often considered "defensive," these sectors can underperform. Rising commodity prices often signal a strong economy and a "risk-on" appetite, causing investors to rotate out of defensive names and into cyclical ones like Energy and Materials.
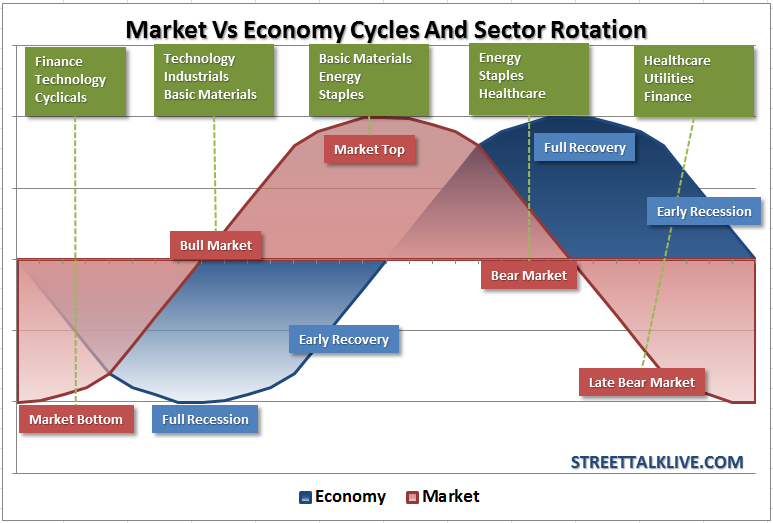
This sector rotation dynamic is a recurring theme in markets and is often visualized in the context of the broader business cycle.
The Analyst's Edge: Thinking in Cycles, Not Straight Lines
Understanding commodity cycles gives you a significant edge because it forces you to think in probabilities and patterns, not in linear extrapolations. Most amateurs make the mistake of "base year fixation"—they look at a company's current earnings and assume they will continue.
As Professor Damodaran explains in his paper, this is a fatal flaw when valuing a commodity company.
- At the peak of the cycle, the company will report record earnings and look deceptively cheap on a Price-to-Earnings (P/E) basis. The amateur buys, assuming the good times will last, only to get crushed when the cycle turns and earnings collapse.
- At the trough of the cycle, the company will report losses or dismal profits, look expensive, and appear to be a terrible investment. This is often the point of maximum opportunity, as the seeds of the next upswing are being sown.
The professional analyst recognizes this trap. Instead of using today's record profits, they attempt to value the business based on a "normalized" commodity price—a sustainable average price over the entire cycle. They quantify the relationship between the commodity price and the company's earnings, much like the regression Damodaran performed for Exxon Mobil, which showed that 90% of the variance in its earnings was explained by the price of oil.
This thinking extends even to how you value a company's assets. A sophisticated analyst views a commodity producer's undeveloped reserves (like an oil company's un-drilled fields) not just as inventory, but as real options. The company has the right, but not the obligation, to develop those reserves. Counter-intuitively, higher volatility in the commodity's price can make these options more valuable, because it increases the chance of an extreme price spike that would make development hugely profitable. This is an advanced concept, but it's central to the operator mindset: you are valuing flexibility and potential, not just current production.
Conclusion
You have now added another critical macro force to your analytical toolkit. Commodity cycles are not just squiggles on a price chart; they are a fundamental driver of corporate performance and market rotation. You can now trace the path of a price shock from the producer to the consumer and identify the sectors poised to win or lose.
Key Takeaways:
- Commodity prices move in powerful boom-and-bust cycles driven by inherent lags between supply and demand.
- These cycles create clear winners (producers in the Energy and Materials sectors) and losers (industries for which commodities are a major input cost, like Airlines and Autos).
- The impact ripples through the economy, affecting corporate margins, driving inflation, and influencing consumer behavior across the board.
- A key analytical edge is to avoid "base year fixation." A pro evaluates a cyclical company based on its earnings power through the cycle, not just at its peak or trough.
In the past few lessons, we've explored how central banks, bond markets, currency fluctuations, and now commodity cycles shape the investment landscape. There is one final macro player whose actions can instantly re-price assets: the government itself. In our next lesson, we will investigate Fiscal Policy, exploring how government spending, taxation, and deficits create their own distinct set of risks and opportunities in the market.