Introduction
In our last lesson, we developed a crucial skill: mapping catalysts. You learned to move beyond reacting to news and instead proactively identify the future events—earnings releases, regulatory decisions, product launches—that could force the market to re-evaluate a stock. We established that a professional operator doesn't predict the future, but they do map the territory of what's possible.
Today, we will weaponize that map. Knowing the potential catalysts is the first step; the next is to quantify their potential impact. This lesson is about translating your catalyst map into a scenario tree. You will learn to build a disciplined framework for thinking about the future not as a single point, but as a distribution of distinct outcomes—a bull case, a base case, and a bear case—and then assign probabilities to each. This is the core of thinking like a professional investor, moving away from the amateur's search for a single "target price" and toward the operator's understanding of expected value.
From Single-Point Forecasts to Probabilistic Thinking
Most market commentary revolves around single-point forecasts: "Our price target for XYZ is $150." This suggests a level of precision that is not only false but dangerous. A company's future is not a fixed point; it's a range of possibilities influenced by the catalysts we discussed. Relying on a single outcome can lead to a false sense of security and catastrophic surprises.
A professional analyst, by contrast, thinks in probabilities. This means acknowledging uncertainty and building a framework to manage it. Let's explore why this shift in mindset is so critical.
Stop Chasing “Fair Value”: Use Monte Carlo & Scenarios to ...
This article from LinkedIn provides an excellent rationale for moving beyond single-point estimates and embracing probabilistic thinking.
First, read the introduction and the section titled Why DCFs Fall Short. The author explains why a single "intrinsic value" is an illusion of precision and how it fails to capture the range of potential outcomes. Pay attention to Warren Buffett's quote about investing being a probability-weighted game. Next, read the section Thinking in Scenarios. This introduces the classic "best case, base case, and worst case" framework and the concept of calculating a probability-weighted expected value. This is the foundational model for today's lesson.
The key takeaway is that by defining scenarios, you're not just guessing three different prices. You are explicitly defining different "worlds" the company could exist in and what its value would be in each. This forces you to think critically about the key drivers and risks.
Building Your Scenario Tree: Bull, Base, and Bear Cases
A scenario tree is a visual and analytical tool for structuring your thinking about a stock's future. At its simplest, it has three main branches:
- The Base Case: This is your most likely scenario. It's often anchored to your own analysis or a slightly modified version of consensus expectations. This path assumes that events unfold more or less as you'd expect, without major positive or negative surprises.
- The Bull Case: This is your optimistic scenario. What happens if a key catalyst materializes with a surprisingly positive outcome? For example, a new product is a runaway hit, a competitor falters, or the economy grows faster than expected, leading to higher revenue growth and margin expansion.
- The Bear Case: This is your pessimistic scenario. It's the world where risks become reality. A key drug trial fails, a recession hits demand, or new regulations cripple the business model. This branch forces you to confront the potential downside.
To make this concrete, let's walk through the mechanics of calculating an Expected Monetary Value (EMV). This simple framework is the engine behind any scenario analysis.
Decision Tree Analysis - Intro and Example with Expected Monetary Value
This short video provides a clean, step-by-step introduction to building a decision tree and calculating Expected Monetary Value.
Watch the entire video, paying close attention to how the presenter structures the problem. Diagramming: Notice how he translates the word problem into a visual tree with costs, payoffs, and probabilities on each branch. Calculating EMV: Follow the calculation. The EMV for each choice is the sum of the initial cost plus the probability-weighted value of each potential outcome. The Conclusion: The final decision is based on comparing the EMVs of the different choices. The choice with the higher EMV is the more rational one over the long run.
This EMV calculation is the heart of scenario analysis. The equation for any given scenario is:
Let's see how this is applied by professionals.
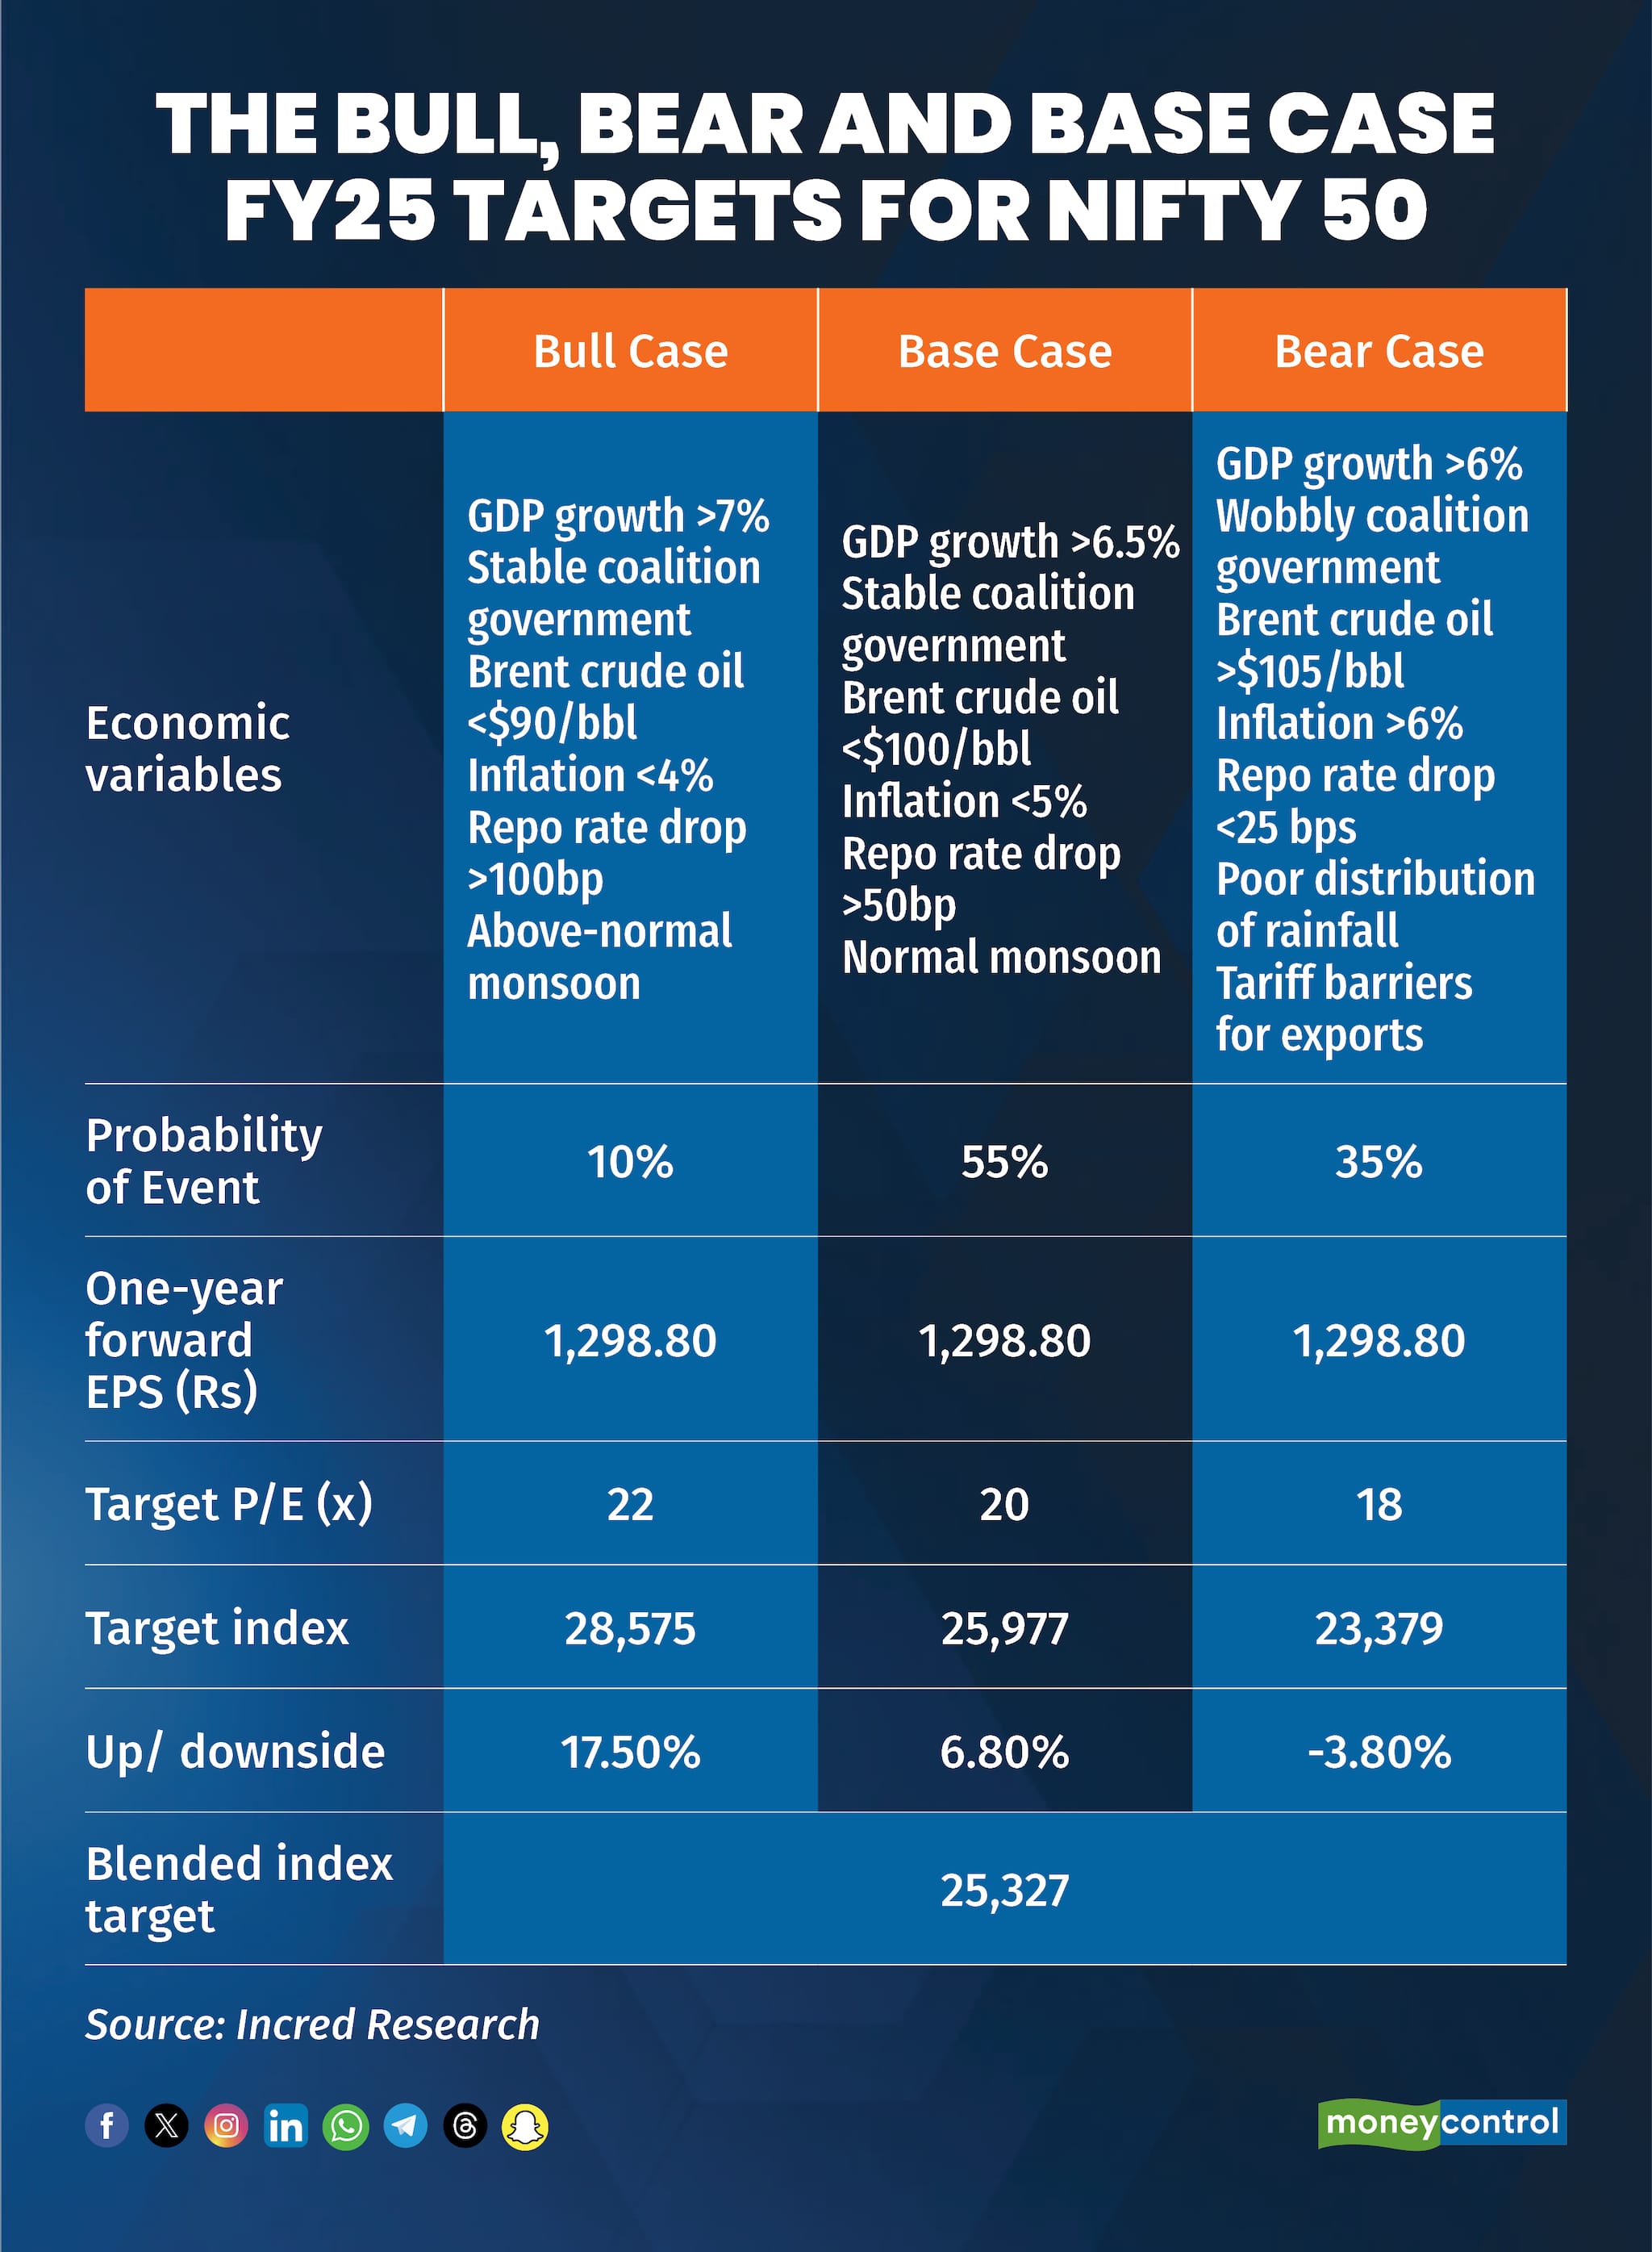
Let's dissect this analysis.
- Economic Variables (The Drivers): For each case (Bull, Base, Bear), the analysts have defined the specific conditions that would lead to that outcome. These are the catalysts. For the Bull case, it's >7% GDP growth, low inflation, etc. For the Bear case, it's a wobbly government, high oil prices, and poor rainfall.
- Probability of Event: This is the critical step of assigning weights. The analysts believe the Base Case is the most likely (55%), with the Bear Case (35%) being more probable than the Bull Case (10%). Note that the probabilities sum to 100% (10% + 55% + 35%).
- Valuation Metrics: They use a consistent forward EPS (Earnings Per Share) of ₹1,298.80 across all scenarios, but they change the Target P/E (Price-to-Earnings) multiple. The market is willing to pay a higher multiple for earnings in a Bull environment (22x) and a lower multiple in a Bear environment (18x).
- Target Index (The Outcomes): By multiplying the EPS by the Target P/E for each case, they arrive at a target index value for each branch of the tree.
- Bull: (rounded to 28,575)
- Base: (rounded to 25,977)
- Bear: (rounded to 23,379)
- Blended Index Target (The Expected Value): This is the final probability-weighted average. The "Blended index target" of 25,327 is the expected value of the Nifty 50 based on this entire scenario tree. It represents a more robust forecast than any single target price because it incorporates the full range of possibilities and their likelihoods.
The Art of Assigning Probabilities
The most challenging part of this process is assigning probabilities. There's no magic formula, but it's not pure guesswork either. It's a blend of quantitative analysis and qualitative judgment, anchored by research.
This paper from Morgan Stanley's Michael Mauboussin is a masterclass in thinking about probabilities and payoffs. It provides the intellectual framework for what we are doing.
First, read the section on Probabilities, starting from the different approaches to setting them. Notice the distinction between frequentist (based on historical data), propensity (based on physical properties), and subjective probabilities. Investing primarily involves subjective probabilities, but they must be disciplined. A key discipline is using base rates. Continue reading from using base rates. A base rate is the historical outcome of a similar reference class. For example, if you're assessing a new drug, the base rate would be the historical success rate of similar drugs in that phase of trials. This grounds your subjective probability in objective data. Finally, read the section on Best practices. Focus on the recommendations to use more than three scenarios and apply sensitivity analysis. This reinforces that Bull/Base/Bear is a starting point, and more complex situations may warrant a more granular tree.
Your process for assigning probabilities should be:
- Start with the Base Rate: What has happened historically in similar situations?
- Incorporate Specifics: How is this company or situation different from the base rate? Does it have a stronger management team, a better product, or a bigger head start? Adjust your probability up or down accordingly.
- Use Your Catalyst Map: The probability of your bull case should be linked to the probability of your identified positive catalysts occurring.
- Be Humble: The goal is not perfect prediction. It's about being more right than the market's implied odds. Force yourself to write the numbers down. This act of quantification prevents vague thinking.
From Scenarios to Decisions
Professor Aswath Damodaran is a leading authority on valuation and a major advocate for probabilistic approaches. He argues that building scenarios is essential for navigating the uncertainty inherent in investing.
Uncertainty in Investing and Valuation: What if questions, Scenario Analysis and Simulations
In this lecture, Professor Damodaran explains how to use scenario analysis as a practical tool for valuation.
Watch the section from scenario analysis. He uses the example of EasyJet facing brexit uncertainty. Instead of trying to guess the single outcome of brexit, he valued the company under three distinct scenarios: "No Deal," "Delayed/Messy Deal," and "Soft/No Brexit." Most importantly, he stresses the need to attach probabilities to complete the analysis and arrive at an expected value. He says, "If you do scenario analysis, go the distance. Don't just do scenarios... tell me which scenarios are the most likely."
The output of a scenario tree isn't just a single number (the expected value). It's the entire distribution of outcomes. This distribution is what gives you a true sense of the risk and reward of an investment, which directly informs how you should act. For example:
- High Conviction, Large Position: Your analysis shows a tight distribution where even the bear case results in a value close to or above the current price. This implies limited downside and a high probability of a positive return. This is a setup for a large, high-conviction position.
- Attractive Average, High Risk: The expected value is well above the current price, but the bear case involves a catastrophic loss. This might be a speculative biotech stock. The payoff profile resembles a lottery ticket. The correct action might be to take a small position (or none at all), acknowledging the high risk of ruin despite the attractive "average" outcome.
- Pass: The expected value is below the current market price. The market's pricing is more optimistic than your probability-weighted analysis. You avoid the stock.
By forcing you to map out the possibilities, a scenario tree helps you remain rational when volatility strikes. If the stock drops and your bear case thesis starts to play out, you're prepared. You've already done the work and can act decisively, rather than panicking.
Conclusion
You have now learned one of the most powerful tools in the professional analyst's toolkit. Moving from a single price target to a probability-weighted scenario tree fundamentally changes the way you view investments. It replaces false certainty with structured thinking about uncertainty.
Key Takeaways:
- Single-point forecasts are fragile. The future is a distribution of outcomes, not a single point.
- Build a scenario tree: Define distinct Bull, Base, and Bear cases based on your catalyst map. Identify the key drivers and estimate a value for the stock in each of these "worlds."
- Assign explicit probabilities: Anchor your probabilities in base rates and your specific analysis. The sum of your probabilities must equal 100%.
- Calculate the expected value: The expected value is the probability-weighted sum of all possible outcomes.
- The distribution informs the decision: The range and shape of your outcomes are as important as the final expected value. Use this information to guide conviction and position sizing.
In our next lesson, we will synthesize the skills you've developed. You'll learn to write a structured one-page investment memo, a document that professionals use to crystallize their thinking. The scenario analysis you learned today will be a central pillar of that memo, providing the quantitative justification for your investment thesis.