Introduction
In our last lesson, we established a framework for judging management quality, focusing on their capital allocation prowess. The decisions a CEO makes about where to deploy cash—reinvesting, acquiring, or returning to shareholders—are not abstract. They are the direct cause of the company's future growth trajectory. A skilled allocator cultivates a garden; an unskilled one buys plastic flowers and hopes no one notices.
Today, we learn to be the discerning inspector who can tell the difference. This lesson is about dissecting a company's growth to distinguish between sustainable, organic expansion and the fragile, often illusory growth fueled by hype or acquisitions. Your goal is to move beyond the headline revenue number and understand its true quality. This is a core skill for any serious analyst, as it’s the bedrock for separating a long-term compounder from a company that is simply running on a treadmill, burning cash to stay in place.
The fundamental principle is simple, and it's the foundation of this entire course.
The Only Fundamental Analysis Video You Will Ever Need... (Full Course: Beginner to Advanced)
This video by Henry Chien of Buttonwood reinforces the central law of investing: in the long run, stock prices follow earnings. Understanding this is crucial because if a company's growth isn't sustainable, its earnings growth isn't sustainable, and eventually, the stock price will reflect that reality.
Watch the introduction from the psychology of price and earnings. Internalize the core relationship: the black line (earnings) dictates the long-term path of the green line (price). Your job as an analyst is to forecast the black line, and that begins with understanding the quality of the growth that produces it.
Organic vs. Inorganic Growth: The Foundational Distinction
All growth is not created equal. The market understands this, and so must you. The first and most important cut is separating organic growth from inorganic growth.
- Organic Growth is growth generated internally by the business. It comes from selling more products to existing customers, winning new customers, innovating, and raising prices. This is growth that is earned.
- Inorganic Growth is growth that is bought. It comes from Mergers & Acquisitions (M&A). When company A buys company B, company A's revenue instantly jumps by the size of company B's revenue.
The market correctly places a significant premium on organic growth. Why? Because it's more capital-efficient, more predictable, and signals a healthier underlying business with a real competitive advantage. Inorganic growth, on the other hand, is fraught with risk. Studies consistently show that most M&A deals fail to create value for the acquirer's shareholders due to overpayment, integration failures, and cultural clashes.
Revenue growth analysis: Sustainable vs artificial growth guide
This article from Winvesta provides an excellent breakdown of this core distinction and its implications for valuation.
Read the section "Organic versus inorganic growth." Pay close attention to the findings from McKinsey and Mercer Capital on the shareholder returns and valuation multiples associated with organic growth. Note the real-world examples of Apple (pure organic) versus Broadcom (aggressive inorganic).
The Analyst's Toolkit for Deconstructing Growth
A great analyst doesn't just read the headline revenue number; they deconstruct it. Here are the tools you'll use to see what's really driving the top line.
1. Volume vs. Price vs. Mix
Revenue growth isn't a monolith. It's a combination of three distinct drivers, each with a different quality signal:
- Volume Growth: The company is selling more units. This is generally the healthiest and most sustainable form of growth, indicating market share gains and strong product-market fit.
- Price Growth: The company is charging more for each unit. This demonstrates pricing power and a strong brand, but it's limited by competition.
- Mix Effect: The company is selling a different combination of products, often shifting toward higher-margin items. This is good for profitability but may not mean the customer base is expanding.
A healthy company exhibits a good balance. A company relying solely on price increases while volumes are flat or falling is a major red flag.
Revenue growth analysis: Sustainable vs artificial growth guide
Let's continue with the Winvesta article to see this decomposition in action.
Read the section on decomposing drivers. The Coca-Cola vs. PepsiCo example is critical. Notice how Coca-Cola's positive volume growth, even if small, signals a fundamentally healthier business than PepsiCo's, which was struggling with volume declines. Also, pay attention to where you can find this data in company filings.
2. The Roll-Up and Multiple Arbitrage Illusion
Acquisition-fueled growth is one of the most common ways that management teams manufacture growth that looks impressive on the surface but is often hollow. A common strategy is the "roll-up," where a larger "platform" company serially acquires smaller "add-on" companies in a fragmented industry.
This can create the illusion of value through a financial trick called multiple arbitrage. The platform company, being larger and publicly traded, might command a 10x EBITDA multiple. It then acquires smaller, private companies for 4-5x EBITDA. By simply rolling up these smaller companies into the larger entity, the value of the acquired earnings is immediately re-rated to the higher multiple, creating paper gains without any underlying operational improvement.
Let's look at a concrete example.
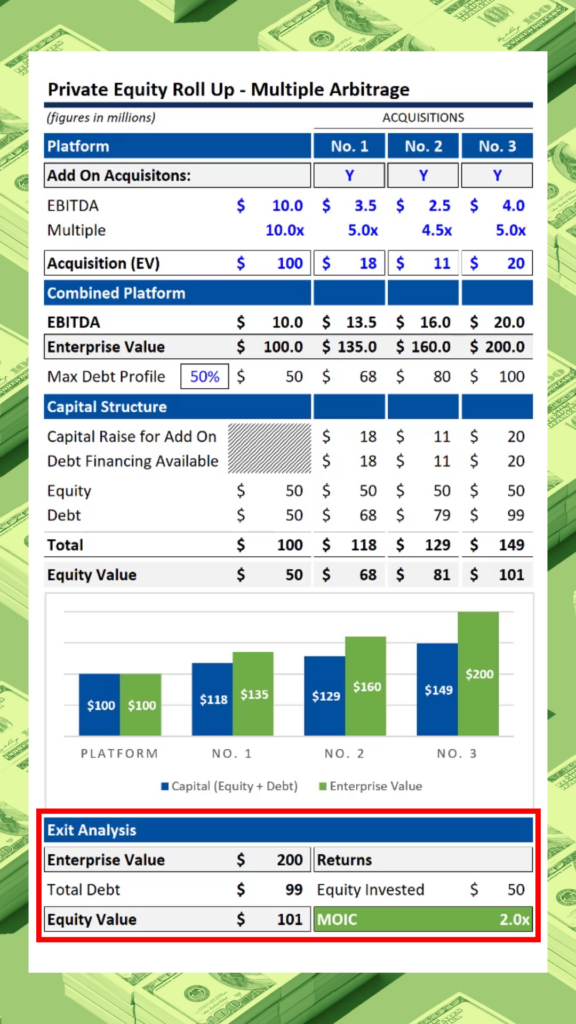
Let's walk through the math in the image:
- Platform: Starts with $10M in EBITDA, valued at 10.0x, for an Enterprise Value (EV) of $100M. The capital structure is 50/50, so $50M Equity, $50M Debt.
- Acquisition 1: The platform buys a company with $3.5M in EBITDA for just 5.0x, paying $18M (rounded). The combined EBITDA is now $13.5M. The market, however, continues to value the entire platform at a high multiple. If we assume the combined platform retains a multiple closer to the original 10x, say 9-10x, the EV balloons. In this specific model, they show the EV growing to $135M. More importantly, the equity value jumps from $50M to $68M.
- The Game: This repeats with acquisitions 2 and 3. By the end, the combined EBITDA is $20M. The EV is $200M, maintaining the 10x multiple. The initial $50M of equity has grown to $101M, a 2.0x return (MOIC - Multiple on Invested Capital), largely driven by this multiple arbitrage, not by making the underlying businesses better.
This is a classic form of hype-driven growth. It looks fantastic on a spreadsheet but is highly vulnerable. If the platform's valuation multiple contracts, the entire model collapses.
3. Red Flags and Warning Signs
Your goal is to "smell" when growth is artificial. Here are the key indicators professional analysts look for.
- Accounts Receivable (AR) Growing Faster Than Revenue: This is the number one warning sign. It suggests the company is "stuffing the channel" (forcing more product onto distributors than they can sell) or recognizing revenue prematurely. Track Days Sales Outstanding (DSO) – if it's rising, be cautious.
- Operating Cash Flow (OCF) Consistently Below Net Income: If a company reports profits but isn't generating cash, the earnings are an accounting fiction. The OCF / Net Income ratio should consistently be around 1.0 or higher.
- One-Time Items and Aggressive Non-GAAP Adjustments: Look for growth boosted by one-off events like asset sales or legal settlements. Be highly skeptical of companies that heavily adjust their GAAP numbers to show "pro-forma" profits.
Revenue growth analysis: Sustainable vs artificial growth guide
The Winvesta article provides a concise list of these critical red flags.
First, read the section "Red flags and revenue manipulation warning signs." Internalize the three main signals: AR outpacing revenue, OCF lagging net income, and channel stuffing. Then, jump back and read the short section on one-time items to understand how those can distort the picture.
Case Study: Deconstructing SoFi's Growth Narrative
Let's apply this toolkit to a real-world, complex example. SoFi (SOFI) is a company that has posted impressive headline revenue growth but has also attracted significant skepticism from short-sellers. This is the kind of messy, real-world situation you will face as an analyst.
Is SoFi Stock Ready to Explode?! | SOFI Stock Analysis
This analysis by Ken Freeman, CFA, is a masterclass in distinguishing hype from reality. He pits the bearish red flags against the bullish indicators and uses a simple "expense test" to cut through the noise.
This video is dense, but it's exactly the kind of "market combat" analysis you need to master. Watch the opening segment that frames the problem: revenue up 35%, profit down. This is the anomaly we need to solve. Next, watch the segment detailing the four red flags. Notice how they align with our toolkit: compressing margins, a short-seller questioning the quality of reported EBITDA (a non-GAAP metric), and a low current ratio. Now watch the bull case, focusing on the sources of real growth: strong performance in the financial services segment, expanding margins there, massive deposit growth (a source of cheap funding), and a significant insider buy from the CEO. Finally, watch the core of the analysis, the 2026 expense test. The key insight is simple: if revenue growth (35%) outpaces expense growth (27%), the company is gaining operating leverage, a sign of sustainable scalability. He also points out a one-time tax benefit that made the previous year's profit look better than it was—a classic example of a one-time item distorting the trend.
The Sweet Spot and the Hype Trap
As you've seen, growth is complex. Extremely high growth is often as dangerous as no growth. Financial researcher Michael Mauboussin's work on "base rates" provides a powerful mental model. He found that for large companies, sustaining 20%+ revenue growth for a decade is extraordinarily rare.
This leads to a useful heuristic: the "sweet spot" for sustainable, value-creating growth often lies in the 7% to 20% range.
- < 7% (Stagnation): The business is likely lagging the market and struggling to create value.
- 7% - 20% (Sweet Spot): The growth is meaningful enough to drive compounding but not so high that it's statistically unsustainable or requires herculean efforts.
- > 20% (Hype Trap): The company is either a rare generational outlier or, more likely, is priced for a level of perfection that it cannot maintain. When growth inevitably slows from, say, 30% to 15%, the valuation multiple often collapses, destroying shareholder returns even if the business is still growing well.
Why Chasing Too Much Growth Destroys Returns (And Where to Look Instead)
This article from Arvy is a fantastic exploration of this mental model, grounded in Mauboussin's data.
Start with the 30-second core thesis to get the main idea. Read the section "Why 20% — the ceiling of physics." The base rate data is the key takeaway here: not a single company starting at $50B+ revenue has sustained 20% growth for a decade. This is a powerful anchor against hype. Finally, review the summary graphic and text under "The three zones of revenue growth." This visualizes the Stagnation, Sweet Spot, and Hype Trap zones.
Case Study: Kroger vs. Walgreens
To lock this in, let's look at one more powerful example that synthesizes everything. For years, Kroger (a grocery store) and Walgreens (a pharmacy) looked like similar, slow-growing retail businesses. But by dissecting the quality of their business and investments, an analyst could have spotted a massive divergence.
The Only Fundamental Analysis Video You Will Ever Need... (Full Course: Beginner to Advanced)
We return to Henry Chien's video for a brilliant case study in comparative analysis. He demonstrates how to use financial statements and qualitative research to see why one company's growth was sustainable while the other's was built on a crumbling foundation.
Watch the entire section comparing Kroger and Walgreens, from the setup to the final result. Focus on these points: The initial numbers (2017-2019): Both look similar, but Walgreens shows declining gross margins and declining free cash flow—early warning signs. The "Why": The research reveals the cause. Walgreens faced structural pressure on reimbursement rates (a shift to lower-margin products). Kroger, meanwhile, was strategically investing in higher-margin "Fresh" produce and "alternative profit streams." The Payoff (2020-2023): Kroger's strategic shift pays off with improving margins and earnings. Walgreens' structural problems worsen, and its earnings collapse. The stock prices followed. This is a perfect illustration of how distinguishing sustainable from unsustainable trends is not academic; it is the direct path to generating alpha.
Conclusion
Growth is the engine of value creation, but you must be a discerning mechanic who understands what's happening under the hood. Simply looking at the speedometer—the headline revenue growth rate—is a recipe for disaster.
Key Takeaways:
- Not all growth is good growth. The market pays a premium for sustainable, organic growth.
- Deconstruct revenue. Break it down into volume, price, and mix to understand the real drivers.
- Beware of artificial growth. Be skeptical of serial acquirers using multiple arbitrage and companies that rely on one-time items or aggressive accounting.
- Follow the cash. If operating cash flow isn't keeping pace with net income, or if accounts receivable are growing faster than sales, something is wrong.
- Mind the Hype Trap. Growth above 20% is statistically rare and often leads to multiple contraction. The 7-20% range is a useful "sweet spot" for identifying sustainable compounders.
In our next lesson, we will build directly on this foundation by examining "Profitability and Scalability." A company with sustainable growth should be able to translate that growth into expanding profit margins. We will explore the concept of operating leverage and how to identify businesses where revenue grows faster than costs, creating a powerful engine for earnings growth.