Hello! Welcome to the first lesson in our final module on debugging and deployment.
In the last lesson, we successfully built a responsive header, adapting AI-generated code to create a polished, user-friendly navigation system. That was an ideal scenario where the code worked as expected. But in the real world, especially when working with AI, you'll inevitably encounter code that is buggy, behaves unexpectedly, or breaks your build entirely.
Today, we'll equip you with the essential tools to diagnose these problems. Our learning outcome is to use Hugo's debugging functions (e.g., printf, warnf) to inspect variables and logic in templates. Mastering these tools is the difference between being frustrated by AI-generated code and confidently wielding it. You'll learn how to look "under the hood" to see exactly what data Hugo is working with at any given point.
The Debugging Mindset: "What's in the Dot?"
The single most common challenge when writing or debugging Hugo templates is understanding the current context. In Hugo, the context is represented by a single variable: . (pronounced "the dot"). This variable holds all the data and functions available to your template at that specific location. For a single page, it contains the page's title, content, and front matter parameters. On a list page, it might contain a collection of pages.
When AI-generated code fails, it's often because it's trying to access a variable that doesn't exist in the current context. Your first step in debugging should always be to ask: "What, exactly, is inside the dot right now?"
Hugo provides several functions to help you answer this question. Let's start with the simplest, then move to the most powerful.
Inspecting Complex Variables with jsonify and debug.Dump
A basic function for printing information is printf. You could try to print a variable like {{ printf "The title is: %s" .Title }}. But what if you want to see everything inside .? You might think to use printf to inspect the whole dot object, but as you'll see, this often yields unhelpful results.
A developer ran into this exact issue, and the solution, provided by Hugo's creator, is now the standard practice for debugging.
How to inspect variables in the current scope in Hugo?
This Stack Overflow discussion, 'How to inspect variables in the current scope in Hugo?', gets straight to the point. It shows why the obvious approach doesn't work and provides two much better alternatives.
Read the question and the accepted answer. Notice how the initial attempt with printf was not useful, and focus on the two recommended solutions: debug.Dump and jsonify.
As you just read, printf can be misleading for complex objects. The two most effective ways to inspect the context are:
{{ . | jsonify (dict "indent" " ") }}{{ debug.Dump . }}
The jsonify function converts the context variable into a human-readable JSON string. debug.Dump provides a more Go-oriented view of the data. Both are invaluable.
Where to See the Output?
You have two main options for viewing the output of these functions:
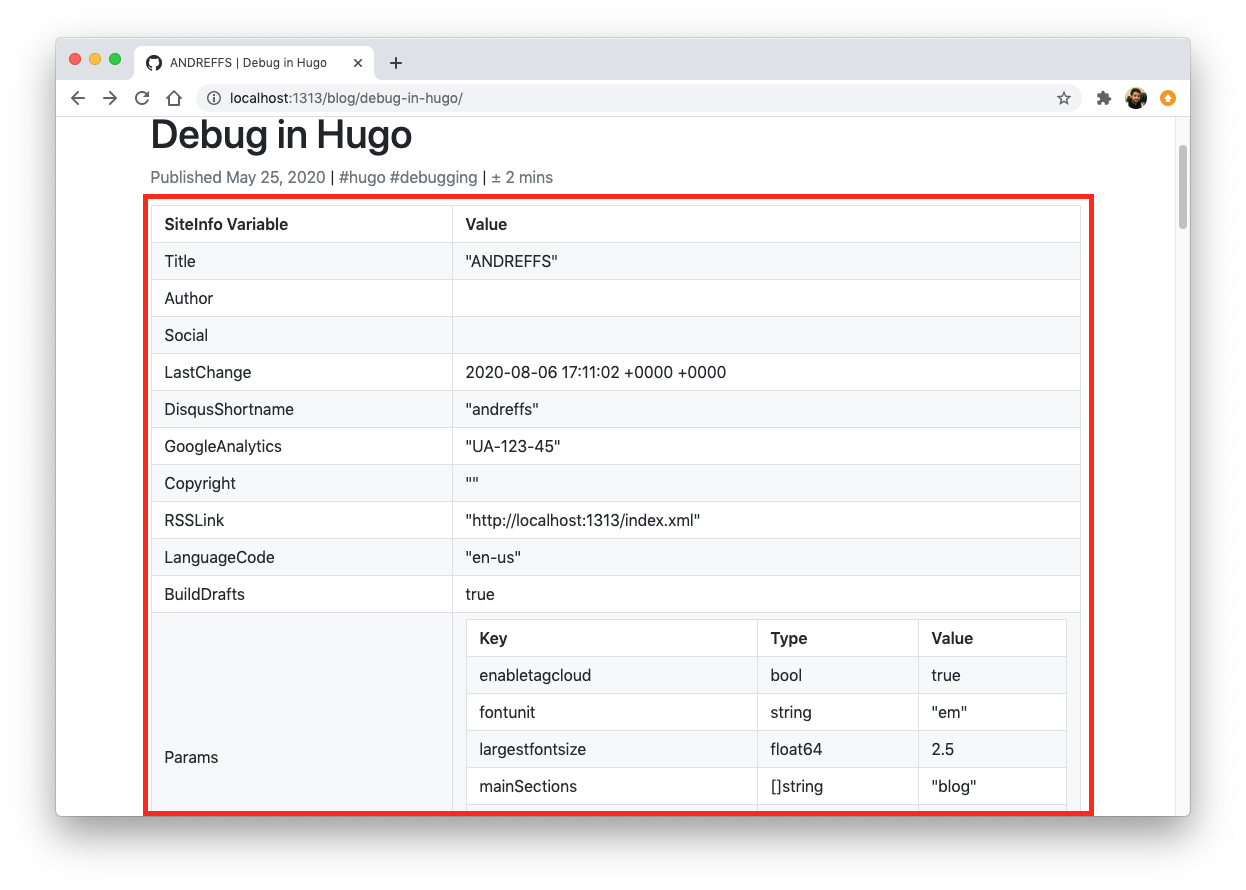
1. Render directly in the HTML:
You can place the debug code inside <pre> tags in your template. This prints the variable's contents directly onto the web page. This is useful for a quick visual check.
<!-- In your template, e.g., layouts/_default/single.html -->
<pre>
  <code>
    {{ . | jsonify (dict "indent" " ") }}
  </code>
</pre>
The result will look something like this, showing you all the available site variables and parameters right on the page.
2. Log to the browser's developer console:
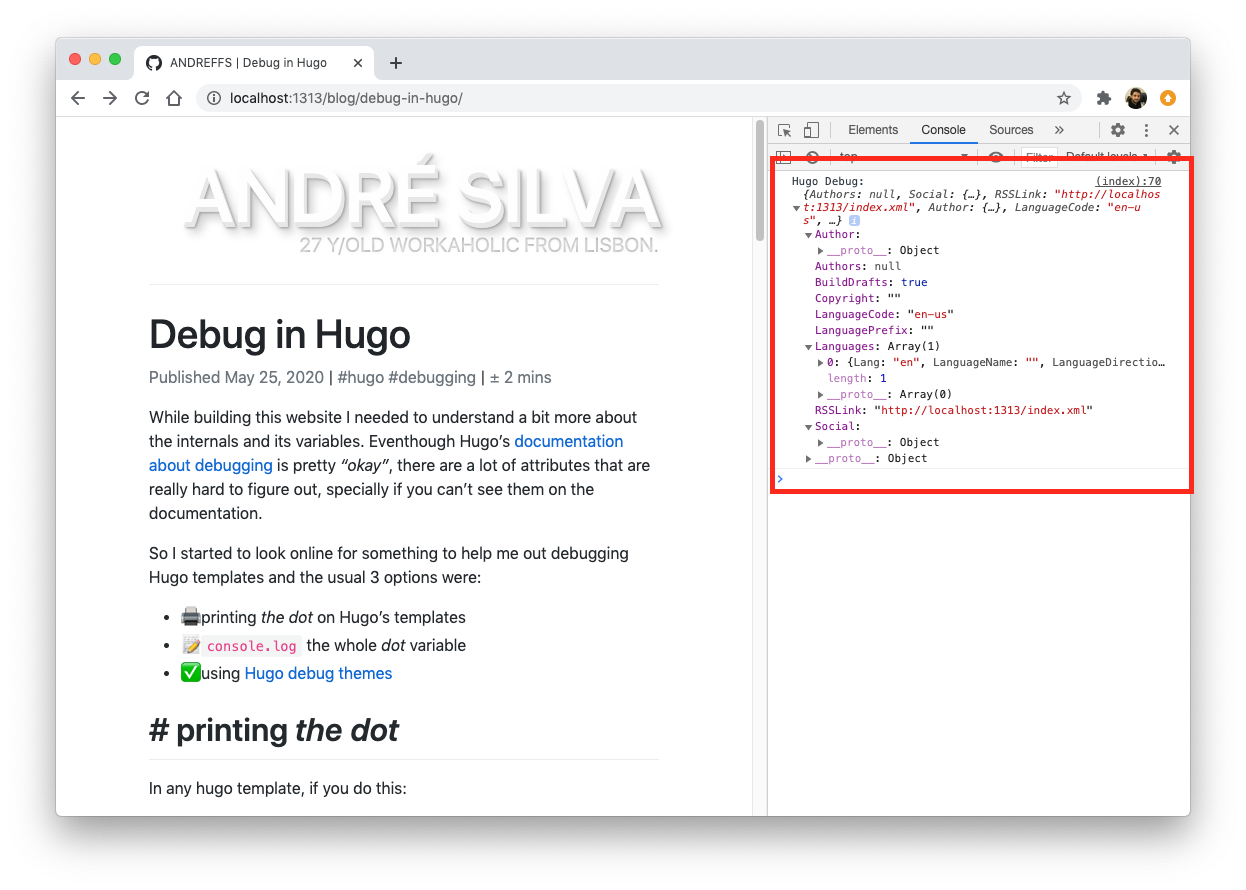
This is often a cleaner approach as it doesn't clutter your rendered page. You can embed a small script that logs the JSON-formatted data to your browser's console. Your experience with Google Analytics and Tag Manager means you're already very familiar with using the developer console.
<!-- In your template, at the bottom before </body> -->
<script>
  console.log('--- HUGO DEBUG ---');
  console.log({{ . | jsonify }});
</script>
When you load the page and open your browser's developer tools, you'll see a fully interactive object that you can inspect.
Test your understanding!
Imagine an AI-generated partial for a "related posts" section isn't working. You suspect the . context inside the partial doesn't contain the page data you expect. Which debugging method (HTML output or browser console) would you use to inspect the context without breaking the page layout for other visitors during development, and why?
Show answer
The browser console method is the ideal choice. By logging the output to the console, you can thoroughly inspect the variable's contents without adding any visible elements to the page itself. This ensures the page layout remains intact while you diagnose the problem.
Enforcing Data Integrity with warnf and errorf
Inspecting variables is for diagnosing problems. But what about preventing them? Given your background managing complex sites and content strategies, you know how important data consistency is. A missing featured image or author name can break a layout.
This is especially critical in your "vibe coding" workflow. Your Google Sheet acts as a CMS. You need a way to ensure that whoever fills out the sheet provides all the necessary data. Hugo's warnf and errorf functions are your automated quality control.
Forcing your Hugo builds to crash, and why you ... - Mani Kumar
The article 'Forcing your Hugo builds to crash, and why you...' by Mani Kumar provides a clear and practical introduction to using warnf and errorf for content validation.
Please read the sections 'Introducing errorf and warnf', 'Using errorf', and 'Using warnf'. Focus on the fundamental difference between the two functions and the example of checking for a missing front matter parameter.
As the article explains, these functions allow you to print formatted messages to your terminal during the hugo build process.
-
{{ warnf "Message: %s" .Path }}: Prints a warning to the console, but the build will continue and succeed. This is perfect for non-critical issues. For example, a missing meta description for SEO is bad, but it shouldn't stop the site from being deployed.{{ if not .Description }} {{ warnf "SEO WARNING: Page '%s' is missing a meta description." .File.Path }} {{ end }} -
{{ errorf "Message: %s" .Path }}: Prints an error to the console and immediately fails the build. This is your safety net for critical data. If a blog post is missing afeatured_imagethat the template requires, you want the build to stop so you can fix it.{{/* In a partial that displays a hero banner */}} {{ if not .Params.featured_image }} {{ errorf "BUILD FAILED: Page '%s' requires a 'featured_image' in its front matter." .File.Path }} {{ end }}When Hugo encounters this
errorf, it will halt and display your custom error message, telling you exactly which file is the culprit. This is incredibly powerful for maintaining site quality at scale.
Conclusion
Today you've added the most important debugging tools for Hugo development to your arsenal. You are no longer flying blind when AI-generated code misbehaves. You now have a systematic way to investigate and validate the data flowing through your templates.
Key Takeaways:
- Most template bugs stem from a misunderstanding of the current context (
.). - Use
{{ . | jsonify }}or{{ debug.Dump . }}to inspect the full contents of any variable or context. - You can output debug information directly into the HTML (using
<pre>) for quick checks or to the browser console for a cleaner, more interactive experience. - Use
warnfto flag non-critical data issues in your build log without stopping the deployment. - Use
errorfto enforce critical data requirements and automatically fail the build if a page is missing essential information, preventing broken pages from ever going live.
Preview of the next lesson:
Now that you have the tools, it's time to use them. In our next lesson, we will troubleshoot common issues in AI-generated code. We'll look at specific real-world examples, like variable scope problems within loops and incorrect function usage, and apply the jsonify and warnf techniques you learned today to solve them.