Welcome back. In our previous lessons, we've explored the architecture of the Clang frontend, from the collaboration between the Parser and Sema to the intricacies of the DiagnosticsEngine. You now have a solid theoretical model of how Clang processes C++ source code. Today, we will bring that model to life.
This lesson marks a crucial transition from theory to practice. Your goal as an aspiring LLVM contributor is not just to understand the code but to interact with it, trace its execution, and diagnose its behavior. The primary tool for this is a debugger. We will focus on setting up your environment for effective debugging and taking the first step: stopping the compiler mid-execution to observe its state. By the end of this lesson, you will be able to set up a debug build of Clang and use a debugger like GDB or LLDB to pause the compiler inside its C++ parsing logic.
The Debugging Ecosystem
Before diving into Clang, let's briefly frame the components involved in debugging a program on a modern operating system. Effective debugging relies on a partnership between the compiler, the executable it produces, the debugger itself, and the operating system kernel.
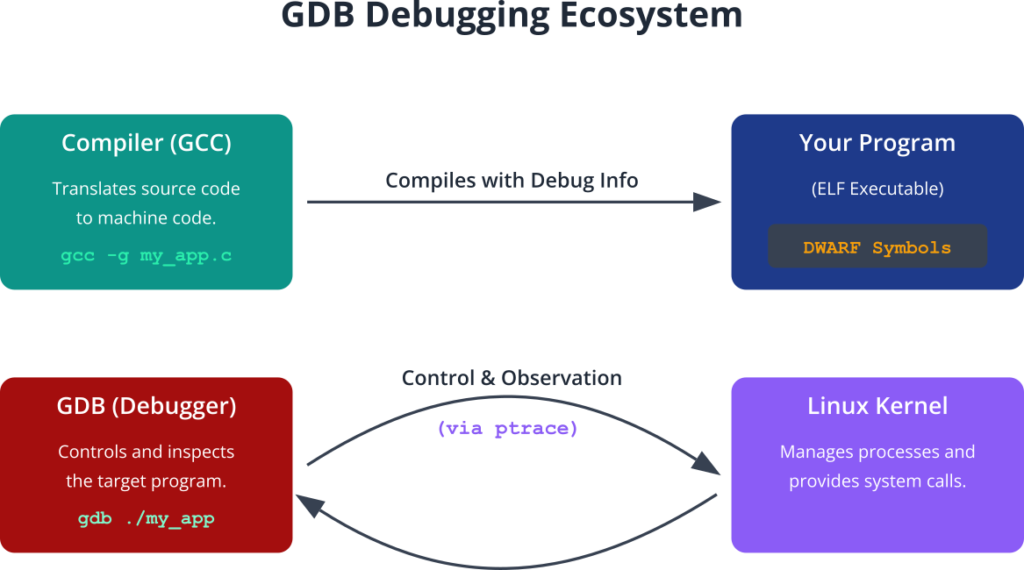
When you compile with a special flag (typically -g), the compiler embeds extra information into the executable file. This information, often in a format called DWARF, maps the compiled machine code back to the original source code constructs—function names, variable names, line numbers, and type definitions. The debugger reads this information to provide a source-level view of the program's execution.
Step 1: Creating a Debug Build of LLVM
In our initial setup, you likely created a "Release" build of LLVM. Release builds are optimized for performance and size, and the debug information is stripped out. To use a debugger effectively, you need a "Debug" build.
A debug build is configured with a specific CMake flag that instructs the build system to:
- Compile with the
-gflag to include DWARF debug information. - Disable most optimizations (
-O0). This ensures the compiled code maps as closely as possible to the source code, making step-by-step debugging predictable. - Enable assertions (
assert()), which are sanity checks within the LLVM codebase that can help pinpoint logical errors.
The trade-off is that a debug build is significantly larger and slower than a release build. However, for development and bug-fixing, it is indispensable.
How to debug to learn LLVM Backend - Beginners
This post on the LLVM Discourse forums, though focused on the backend, provides the exact steps needed for our goal. It's an excellent example of the kind of community knowledge you'll be tapping into as a contributor.
Read the first few paragraphs, starting from the top until just before the GDB/LLDB commands. Pay close attention to the CMake flag for a debug build. Also, note the advice on verifying that your final binary contains debug symbols, which we'll do next.
To reconfigure your LLVM build for debugging, you would navigate to your build directory, clear any previous CMake cache if necessary, and run CMake with the new build type. For example:
cd llvm-project/build
cmake -G Ninja ../llvm \
  -DCMAKE_BUILD_TYPE=Debug \
  -DLLVM_ENABLE_PROJECTS="clang;lldb"
ninja
(Note: Running this will take several hours and consume a large amount of disk space, potentially over 100 GB. You can proceed with this now or simply understand the process and use your existing build for the time being, though some debugging features may be limited.)
After the build completes, you can verify that you have a debug binary. As the forum post suggests, you can use the file command. The output should explicitly state that the binary contains debug information.
$ file ./bin/clang-19
./bin/clang-19: ELF 64-bit LSB shared object ... with debug_info, not stripped
Step 2: Launching Clang in a Debugger
With a debug-enabled clang binary, you can now launch it under the control of a debugger. The two most common debuggers in the open-source world are GDB (the GNU Debugger) and LLDB (the LLVM Debugger). Since LLDB is part of the LLVM project, it has excellent support for debugging Clang itself. We'll show commands for both.

The clang Driver vs. clang -cc1
A critical concept when debugging the Clang frontend is the distinction between the driver and the frontend.
clang: This is the driver. Its job is to parse command-line arguments and orchestrate the compilation process, which may involve invoking other tools (like the assembler and linker).clang -cc1: This is the actual frontend—the part that does the lexing, parsing, semantic analysis, and code generation.
When you run clang my_file.cpp, the clang driver often spawns a separate clang -cc1 process to do the heavy lifting. If you attach your debugger to the clang driver, your breakpoints in the parsing logic will never be hit, because that code runs in a different process. This is a very common point of confusion for new contributors.
The solution is to ask the driver to print the exact cc1 command it would have run, and then debug that command directly. The magic flag for this is -###.
How to use LLDB to single-step debug clang for crash issue? - LLDB - LLVM Discussion Forums
This forum thread is a perfect case study. A developer is trying to debug a crash in Clang's parser but their breakpoint isn't being hit.
Read the initial question and the helpful responses. Note how the community quickly identifies the likely problem: debugging the driver instead of the subprocess. Then, focus on the accepted solution: using -### to get the cc1 arguments and debugging that command instead.
Step 3: Setting a Breakpoint in the Parser
Now, let's put everything together. Our goal is to stop execution inside Clang's C++ parsing logic. From our previous lessons, we know the clang::Parser class is responsible for this. A good central function to break on is clang::Parser::ParseTopLevelDecl, which is the entry point for parsing a declaration at the top level of a file.
Here is the complete workflow:
1. Create a simple C++ file to compile.
Save the following as test.cpp:
int main() {
    int x = 42;
    return 0;
}
2. Generate the cc1 command.
Run your newly built clang with the -### flag. You'll get a lot of output; you are looking for the line that begins with clang-19" -cc1.
# Use the path to your own build directory
path/to/your/llvm-project/build/bin/clang -### test.cpp
The output will look something like this (abbreviated for clarity):
...
"/path/to/your/llvm-project/build/bin/clang-19" "-cc1" "-triple" "x86_64-..." ... "-o" "/tmp/test-xyz.o" "-x" "c++" "test.cpp"
...
3. Launch the debugger with the cc1 command.
Copy the entire cc1 command (including the quoted executable path and all its arguments) and use it to launch LLDB.
For LLDB: lldb -- <paste the full command here>
For GDB: gdb --args <paste the full command here>
Example using LLDB:
lldb -- "/path/to/your/llvm-project/build/bin/clang-19" "-cc1" ... "test.cpp"
You will now be at the (lldb) or (gdb) prompt.
4. Set the breakpoint.
Tell the debugger where to stop. We'll use the fully qualified C++ name of the method.
- In LLDB:
(lldb) breakpoint set --name clang::Parser::ParseTopLevelDecl- Shorthand:
(lldb) b clang::Parser::ParseTopLevelDecl
- Shorthand:
- In GDB:
(gdb) break clang::Parser::ParseTopLevelDecl
The debugger will confirm that the breakpoint has been set.
5. Run the program.
Type run (or r) and press Enter.
(lldb) run
Clang will begin executing. It will almost immediately hit your breakpoint and pause execution. The debugger will print the current file and line number, showing you exactly where you are inside the Clang source code. It might look something like this:
Process 12345 launched: ...
Process 12345 stopped
* thread #1, name = 'clang-19', stop reason = breakpoint 1.1
    frame #0: 0x... clang-19`clang::Parser::ParseTopLevelDecl(...) at Parser.cpp:1234
-> 1234   // Some code inside the function
   1235   ...
Success! You are now actively debugging the Clang frontend.
A Quick Reference of Debugger Commands
As we move forward, you'll need a few basic commands to navigate the code. Here are the essentials for both GDB and LLDB.
| Action | GDB Command | LLDB Command | Description |
|---|---|---|---|
| Run | run (or r) |
run (or r) |
Starts or resumes program execution. |
| Continue | continue (or c) |
continue (or c) |
Resumes execution until the next breakpoint or program end. |
| Step Over | next (or n) |
next (or n) |
Executes the current line and stops on the next line. |
| Step Into | step (or s) |
step (or s) |
If the current line contains a function call, enters the function. |
| Step Out | finish |
finish |
Continues execution until the current function returns. |
| Backtrace | backtrace (or bt) |
bt |
Shows the current function call stack. |
| Print Var | print <var> (or p) |
print <var> (or p) |
Displays the value of a variable. |
These commands are the fundamental tools for exploring a program's state and control flow.
9.2 - Debugging - GDB Tutorial
This video provides a general tutorial on GDB. While you may already be familiar with debuggers, it's a good refresher on the core concepts.
Watch the section on next vs step to solidify your understanding of these crucial navigation commands. You can also review the section on backtrace to see how it's used to understand the call stack.
Conclusion
In this lesson, you have taken a massive practical step towards becoming an effective LLVM contributor. You've learned how to prepare a debug build, how to navigate the complexities of the Clang driver, and how to set a breakpoint to pause the compiler at a precise location in its source code. This is the foundational skill upon which all active debugging and code exploration is built.
Key Takeaways:
- A debug build (
-DCMAKE_BUILD_TYPE=Debug) is essential for source-level debugging, as it includes debug symbols and disables optimizations. - The
clangexecutable is a driver that often spawns aclang -cc1frontend process. To debug the frontend, you must debug thecc1process directly. - Use
clang -###to find the exactcc1command line for your compilation. - The basic debugging workflow is: launch the debugger with the correct command (
lldb -- ...), set breakpoints (b ...), and run (r).
In our next lesson, we will leverage this new skill. With the program paused at our breakpoint, we will use the step, next, and print commands to walk through the parsing of a simple C++ expression, observing firsthand how the corresponding AST node is constructed by Sema.