Welcome back. In our previous lesson, we established a conceptual model of the Clang Abstract Syntax Tree, exploring its hierarchical nature and the primary node families—Decl, Stmt, Expr, and Type. We saw how these components represent the grammatical and semantic structure of a C++ program.
Today, we transition from theory to practice. The goal of this lesson is to master the essential tool for viewing this structure directly: clang -Xclang -ast-dump. Learning to generate and interpret the AST dump is a non-negotiable skill for anyone looking to diagnose frontend bugs, understand compiler behavior, or build tools on top of Clang. This is one of the first commands you will reach for when triaging a new issue.
Generating the AST
To inspect the AST, Clang provides a special, non-standard flag. Because this flag is intended for Clang developers and not part of the standard set of compiler options compatible with GCC, you must pass it to the frontend component of the compiler using the -Xclang driver option.
Introduction to the Clang AST — Clang 23.0.0git documentation
The official Clang documentation provides a concise introduction to the -ast-dump flag.
Read the section titled Examining the AST. This section introduces the command and shows its output for a simple function, mapping the nodes in the dump back to the source code.
As the documentation explains, the command is clang -Xclang -ast-dump <source_file>. A common and useful companion flag is -fsyntax-only, which tells Clang to stop after running the frontend analysis phases. This prevents it from generating any object files, saving time when all you want to do is inspect the AST.
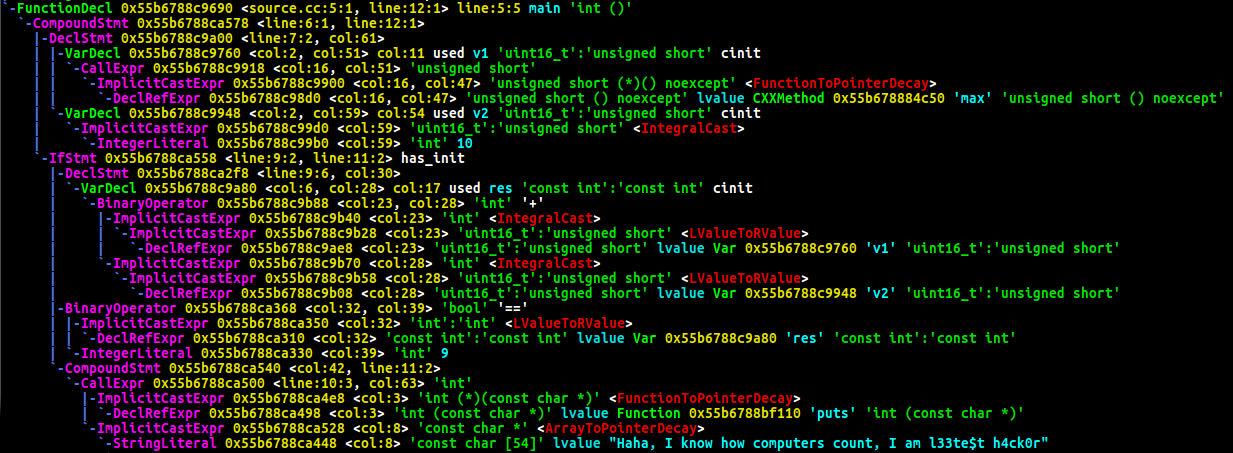
The output is a text-based representation of the tree. The indentation of the text signifies the parent-child relationships between nodes.
Deconstructing the AST Dump
Let's analyze the output for a slightly more complex piece of code involving control flow. Understanding how constructs like if statements are represented is crucial.
Understanding the Clang AST | Jonas Devlieghere
This blog post by Jonas Devlieghere provides a clear, annotated example of an AST dump for an if-else statement.
Focus on the Example section. First, examine the simple C++ function f(int i). Then, carefully study the corresponding AST dump provided. Pay close attention to the IfStmt node and identify its children: the condition, the "then" branch (CompoundStmt), and the "else" branch (CompoundStmt).
The example you just read reveals the rich detail available in the dump. Let's break down a single line from that dump to understand its anatomy:
|-BinaryOperator 0x2ac4540 <line:2:9, col:13> '_Bool' '>'
|-: The tree-like ASCII art shows this node is a child of theIfStmt. A ``` indicates the last child of a parent.BinaryOperator: This is the class name of the AST node, which you'll recognize from our previous lesson. This node represents the>operation.0x2ac4540: The memory address of this C++ object in the compiler's memory. This is invaluable when debugging Clang itself with GDB or LLDB, as you can set breakpoints and inspect this specific object. For now, you can generally ignore it.<line:2:9, col:13>: The source range this AST node corresponds to. It starts at line 2, column 9, and ends at line 2, column 13. This is how the compiler connects the AST back to your code, which is essential for error reporting.'_Bool': The type of the expression represented by this node. The expressioni > 0evaluates to a boolean.'>': Node-specific information. For aBinaryOperator, this indicates the specific operator.
Implicit Nodes
One of the most powerful aspects of the AST dump is that it reveals things the compiler does implicitly. In the dump, you would have seen nodes like ImplicitCastExpr. For example, in the condition i > 0, the variable i is an lvalue (it has a location in memory), but the > operator needs its rvalue (its actual integer value). The compiler inserts an ImplicitCastExpr <LValueToRValue> to represent this conversion. Seeing these implicit nodes is often the key to understanding type-related bugs or unexpected compiler warnings.
An Expert's Walkthrough
To tie all these concepts together, let's watch a segment from the LLVM Developers' Meeting presentation we saw in the last lesson. Here, the presenter does exactly what we've been practicing: connecting the C++ code to the AST node classes and then to the final -ast-dump output.
2019 LLVM Developers’ Meeting: S. Haastregt & A. Stulova “An overview of Clang ”
This is a clip from the "An overview of Clang" presentation.
Watch the segment from this demonstration of -ast-dump. The speaker connects the FunctionDecl, ParmVarDecl, IfStmt, BinaryOperator, and DeclRefExpr nodes in the textual dump directly back to the simple factorial function example. This is the exact workflow you will use when debugging.
The AST Dump in Practice
As a contributor, ast-dump is part of your daily toolkit. When a user files a bug report with a piece of code that miscompiles or crashes the compiler, your first step is often to run it through clang -Xclang -ast-dump to see how the frontend perceived the code. A strange or malformed tree structure immediately narrows your search to the Parser or Sema (semantic analysis).
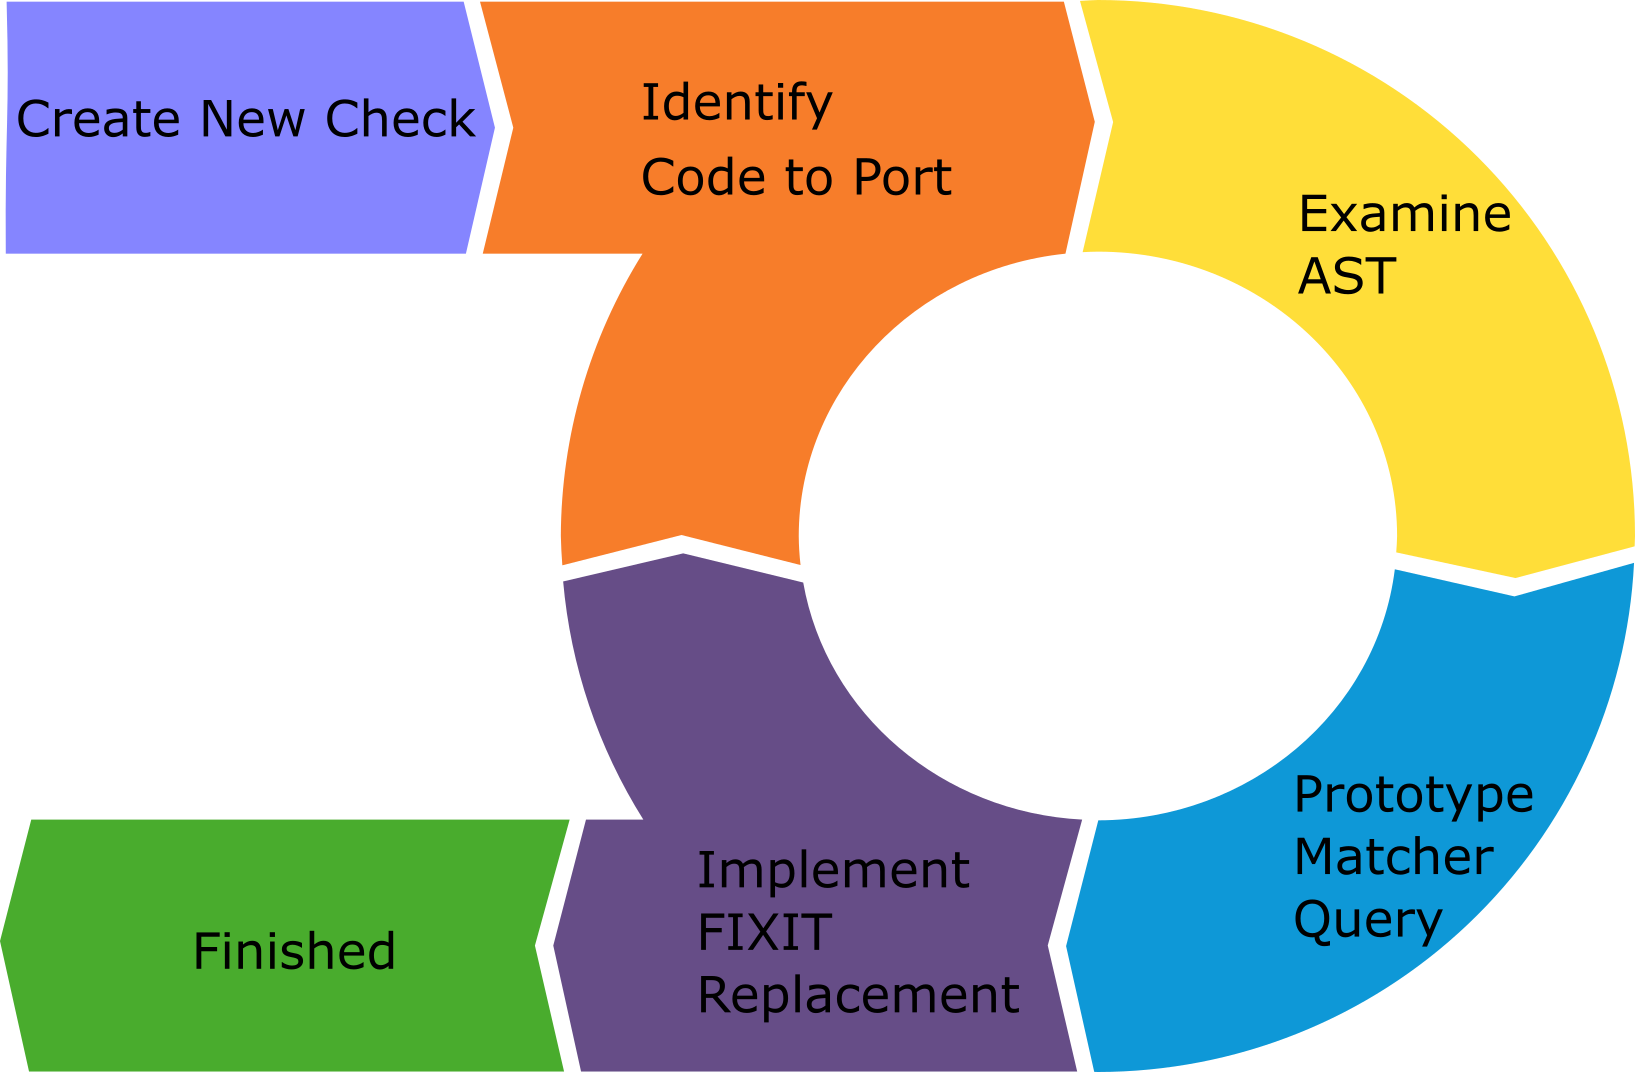
Furthermore, this tool is indispensable when writing your own Clang-based tools or static analysis checks. You first dump the AST for a piece of code you want to match, which tells you the exact sequence and type of nodes you need to look for.
Conclusion
In this lesson, you have acquired the fundamental practical skill of generating and interpreting Clang's AST. You have moved beyond the abstract concept of a tree to a concrete, textual representation that you can generate for any C++ program. This ability is the bridge between seeing a bug in source code and finding its root cause in the compiler's logic.
Key Takeaways:
- The
clang -Xclang -ast-dumpcommand is the primary tool for inspecting the Clang AST. Using it with-fsyntax-onlyis an efficient workflow. - The indented text output directly visualizes the AST's parent-child hierarchy.
- Each line in the dump provides rich metadata, including the AST node's class, its location in the source code, and its C++ type.
- The AST dump reveals implicit compiler actions, such as type casts (
ImplicitCastExpr), which are crucial for debugging subtle issues. - Examining the AST is a core step in the workflow for both fixing bugs and developing new Clang-based tools.
In our next lesson, we will take a step back and examine the process that creates this tree. We will look at the general flow of how Clang's Parser and Sema components work together to build the AST nodes you now know how to inspect. Understanding this construction process is the next logical step toward debugging the Clang frontend.