In our previous lesson, we established a blueprint for organizing frontend code into distinct layers: UI, Application, Domain, and Data. This separation of concerns is the bedrock of a maintainable system. Now, we'll focus on how to visually communicate that structure through high-level architecture diagrams, a critical skill for designing large-scale applications and aligning teams.
This lesson will guide you through the process of translating system requirements into a clear and effective diagram. We won't just be drawing boxes and arrows; we will follow a structured methodology that starts with understanding the problem and culminates in a visual representation of your architectural solution. By the end, you'll be equipped to create diagrams that articulate the key components of a frontend application and their interactions, fulfilling the final objective of our foundational module.
From Requirements to Diagrams: A Structured Approach
Creating an architecture diagram isn't an artistic exercise; it's a design process. A great diagram is the output of a logical thought process that begins with a deep understanding of what the system needs to do. A structured framework helps ensure you cover all critical aspects.
A widely-used approach in system design interviews and real-world practice is to systematically move from requirements to the final design. Let's explore the initial, most crucial steps of this process.
The RADIO Framework | Front End System Design Playbook
This article from the "Front End System Design Playbook" introduces the RADIO framework (Requirements, Architecture, Data Model, Interfaces, Optimizations). We will focus on the first two steps, which are fundamental to creating any architecture diagram.
Please read the first two main sections of the article: Start with Requirements exploration. Pay close attention to the distinction between functional and non-functional requirements. This is the most critical input for your design. Next, read Architecture / High-level design. This section explains how to identify key components and their interactions, which will become the building blocks of your diagram.
As the article highlights, non-functional requirements (like performance, scalability, and reliability) are often what drive the most significant architectural decisions. A functional requirement might state, "A user can view their news feed," while a non-functional requirement clarifies, "The news feed must load in under 2 seconds and support infinite scrolling with no noticeable lag." The latter has far greater implications for your architecture.
A Model for Visualizing Architecture: The C4 Model
Once you have a grasp of the requirements, you need a way to visualize the architecture. Simply drawing random boxes can lead to confusing and ambiguous diagrams. The C4 model provides a fantastic framework for creating clear, hierarchical maps of a software system at different levels of detail.
For high-level frontend architecture, we are primarily concerned with the first two levels:
- Level 1: System Context Diagram - Shows the big picture. It places your system in its environment, showing how it interacts with users and other external systems.
- Level 2: Container Diagram - Zooms into your system. It breaks the system down into its major structural blocks, which the C4 model calls "containers." A container is a separately runnable or deployable unit, such as a single-page application (SPA), a mobile app, a server-side web application, or a database.
The following video by Simon Brown, the creator of the C4 model, is the definitive guide to this approach.
Visualising software architecture with the C4 model - Simon Brown, Agile on the Beach 2019
This presentation offers a clear, practical introduction to creating structured architectural diagrams. You'll learn the purpose of the key diagram types and best practices for making them easy to understand.
Please watch the following segments: System Context Diagram (Level 1): Watch from this section to understand how to create a high-level, zoomed-out view of your system and its external interactions. Container Diagram (Level 2): Continue from this segment to see how to zoom into the system to show its constituent applications and data stores (e.g., your frontend SPA, a backend API). Tips for Good Diagrams: Watch from this part for invaluable, practical advice on how to make your diagrams effective. Pay attention to the guidance on titles, text descriptions, and the meaning of lines and arrows.
The key takeaway is that each diagram level tells a different story to a different audience. A Context diagram is perfect for discussing the system with product managers or non-technical stakeholders. A Container diagram is what you would use to discuss technology choices and high-level responsibilities with fellow engineers.
Putting It All Together: Diagramming a Social Media Feed
Let's apply these concepts to a concrete example: designing the frontend for a social media feed, similar to the one discussed in the RADIO framework resource.
1. Requirements
First, we define the requirements.
- Functional Requirements:
- Users can view a feed of posts from people they follow.
- Posts can contain text and an image.
- Users can create a new post.
- The feed should update with new posts.
- Non-Functional Requirements:
- Performance: The initial feed must load quickly (Time to Interactive < 3s). Scrolling must be smooth.
- Scalability: The feed should handle a virtually infinite number of posts (infinite scroll).
- Reliability: The UI should handle API errors gracefully.
2. Architecture & Diagram
Based on these requirements and the layered architecture from our last lesson, we can identify the key building blocks.
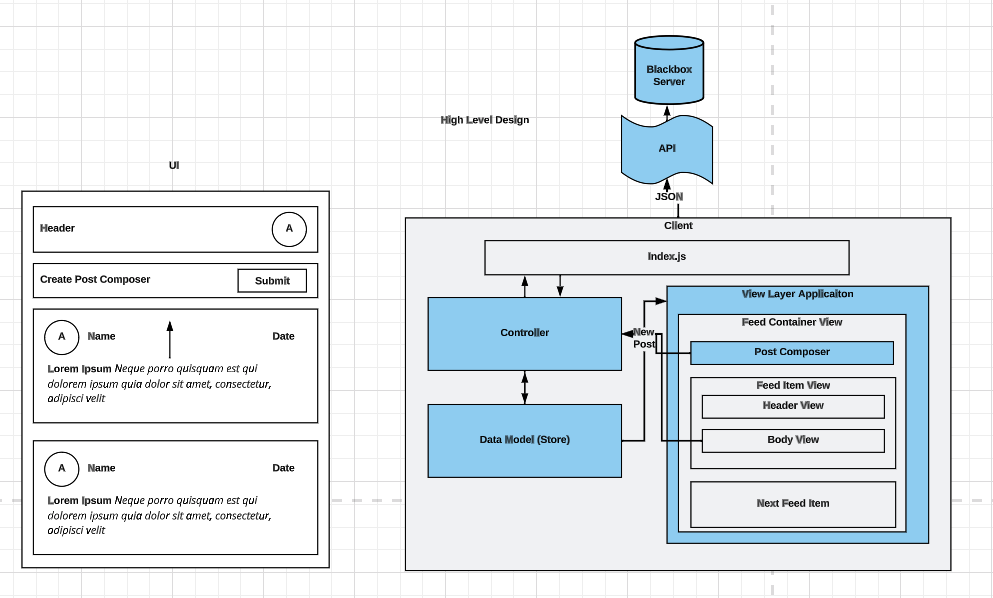
This diagram is an excellent example of a high-level frontend architecture view, closely resembling a C4 Container Diagram. Let's break it down:
- System Boundary: The large "Client" box represents our system boundary. Everything inside is part of our frontend application. This would be the "Internet Banking System" box in the C4 video's example.
- Containers & Components:
- The Client itself is a container—specifically, a Single-Page Application running in the user's browser.
- The Blackbox Server is an external system that our client depends on, communicating via an API that returns JSON. This aligns with the "Mainframe Banking System" in the C4 Context diagram.
- Internal Structure: Inside the client, the diagram shows the logical components that implement our layered architecture from the previous lesson:
- View Layer Application: This is the UI Layer. It contains the visual components (
Feed Container View,Post Composer, etc.). - Data Model (Store): This represents the Application/State Layer and parts of the Domain Layer. It holds the application's state, like the list of posts and user information.
- Controller: This is part of the Application Layer. It orchestrates the flow of data, responding to user actions (like submitting a post) and fetching data from the server to update the store.
- View Layer Application: This is the UI Layer. It contains the visual components (
- Data Flow: The arrows clearly show the interactions:
- The
Controllerfetches data from theServerand updates theData Model. - The
View Layerreads data from theData Modelto render the UI. - User interactions in the
View Layer(e.g., clicking "Submit") trigger actions in theController.
- The
This single diagram effectively communicates the major technical components, their relationships, and how they work together to deliver the features defined in the requirements. It builds directly on the conceptual layers we discussed previously, giving them a concrete form.
Conclusion
In this lesson, we bridged the gap between abstract architectural principles and concrete visual communication. You learned a systematic process to derive a high-level architecture diagram from a set of functional and non-functional requirements.
Here are the main takeaways:
- Architecture starts with requirements: Functional requirements define what a system does, but non-functional requirements (performance, scalability) define how it must do it and are the primary drivers of architectural design.
- Use a structured model for clarity: The C4 model provides a powerful, hierarchical way to create diagrams. For frontend architecture, the System Context and Container diagrams are the most relevant high-level views.
- Diagrams are communication tools: A good diagram is clear, explicit, and tells a story. It should define components, their responsibilities, the technologies used, and the interactions between them.
- Connect architecture to layers: A high-level diagram should visually represent the logical layers of your application (UI, State, Data Services), showing how they are composed into a cohesive system.
We have now completed the foundational module of our course. You have learned to identify quality attributes, compare architectural styles, apply separation of concerns, and now, to visualize and document a high-level design.
In our next lesson, we will begin Module 2 by zooming into the UI Layer. We'll move from the high-level system view to the micro-level, focusing on how to design effective and scalable component prop interfaces—the contracts that govern how the building blocks of your UI interact.