Introduction
Welcome to the final lesson in our module on low-level system control. In the previous lessons, you mastered the memory map, modified linker scripts, and built a robust bootloader with CRC verification. You now have a solid understanding of how firmware is organized in memory. However, a correctly placed application can still fail spectacularly at runtime due to improper memory usage.
One of the most common and difficult-to-debug runtime errors is a stack overflow. This occurs when a program tries to use more stack memory than is available, leading to data corruption and often a system crash into the HardFault_Handler.
This lesson will equip you with the tools and techniques to conquer this problem. We will cover:
- The causes and symptoms of stack overflows.
- How to configure your project to detect stack overflows.
- How to use static and dynamic analysis tools in STM32CubeIDE to identify and debug these issues in both bare-metal and FreeRTOS applications.
Mastering stack management is a critical skill for building stable and reliable embedded systems, moving you one step closer to your goal of becoming a professional firmware engineer.
1. What is a Stack Overflow?
As you know from our work with linker scripts, the stack is a region of RAM used for temporary data storage. Each time a function is called, a "stack frame" is pushed onto the stack to store:
- Local variables declared inside the function.
- The return address (where to go back to after the function finishes).
- Function arguments (depending on the calling convention).
- Saved CPU registers.
A stack overflow happens when the stack pointer (SP) moves beyond the memory region allocated for the stack. This can happen in two main ways:
- Excessively Deep or Infinite Recursion: A function calls itself repeatedly without a proper exit condition, pushing a new stack frame each time until memory runs out.
- Large Local Variables: A function declares a very large local variable (especially an array) that consumes all available stack space in one go.
The result is that the stack "overflows" into adjacent memory regions, corrupting whatever data was stored there—be it global variables, the heap, or another task's stack. This often leads to a HardFault when the CPU tries to use the corrupted data, such as a bogus return address.
Let's watch a video that brilliantly demonstrates these failure modes.
#10 Stack Overflow and Other Pitfalls of Functions
The video '#10 Stack Overflow and Other Pitfalls of Functions' from Quantum Leaps, LLC, provides an excellent visual demonstration of stack overflows. Although it uses a different IDE (IAR), the underlying ARM Cortex-M architecture and C language behavior are identical to our setup.
Please watch these two key segments: Classic Overflow (03:17 - 10:09): Pay attention to how the recursive function calls cause the stack to grow until it runs out of RAM, triggering a BusFault_Handler (a specific type of HardFault). Subtle Corruption (11:41 - 17:53): This part shows a more insidious bug. An out-of-bounds array write on the stack corrupts the saved return address. Notice how the program continues to run erratically for thousands of cycles before finally crashing. This highlights why these bugs can be so hard to track down.
As you saw, a stack overflow doesn't always cause an immediate crash. It can lead to unpredictable behavior that is very difficult to debug. This is why we need specific tools to help us.
2. Static Analysis: Estimating Stack Usage
The first line of defense is to estimate how much stack your application might need before you even run it. STM32CubeIDE includes a Static Stack Analyzer for this purpose. It analyzes your compiled code and calculates the maximum stack depth for any given call chain.
Configuring the Analyzer
To use the analyzer, you first need to tell the GCC compiler to generate stack usage information.
- In your project explorer, right-click the project and go to Properties.
- Navigate to C/C++ Build > Settings > Tool Settings tab > MCU GCC Compiler > Miscellaneous.
- In the "Other flags" field, add the flag:
-fstack-usage. - Click Apply and Close.
Adding the -fstack-usage flag in STM32CubeIDE project properties.
The Static Stack Analyzer requires the -fstack-usage compiler flag to be enabled.
After you rebuild your project, you can view the results.
Code optimization with Stm32 Cube IDE
The article 'Code optimization with Stm32 Cube IDE' from Disk91 provides a concise guide on how to enable and use the Static Stack Analyzer.
Read the section titled 'Stack size details'. Focus on the screenshots showing the 'Static Stack Analyzer' tab and the 'Call Graph'. This will show you what the output looks like and how to interpret it.
The analyzer tells you the "local cost" of each function (how much stack it uses itself) and can show you the "maximum stack cost" for the entire call graph, giving you a good baseline for the required stack size.
Setting the Main Stack Size
The total size of the main stack is defined in your project's linker script. Based on the static analysis (and adding a healthy safety margin), you can adjust this value.
Code optimization with Stm32 Cube IDE
The same article also points out exactly where this setting is located.
Read the short section just above 'Stack size details', which shows the _Min_Stack_Size variable inside the .ld file. This is the value you would change to configure the size of the main stack.
Remember that static analysis is an estimate. It can't account for interrupt nesting or other complex runtime behaviors, which is why we also need dynamic analysis.
3. Dynamic Analysis in a FreeRTOS Environment
In a FreeRTOS application, the situation is more complex and also more powerful. Each task has its own stack, allocated from the FreeRTOS heap. The main stack (defined in the linker script) is typically only used by interrupt service routines (ISRs).
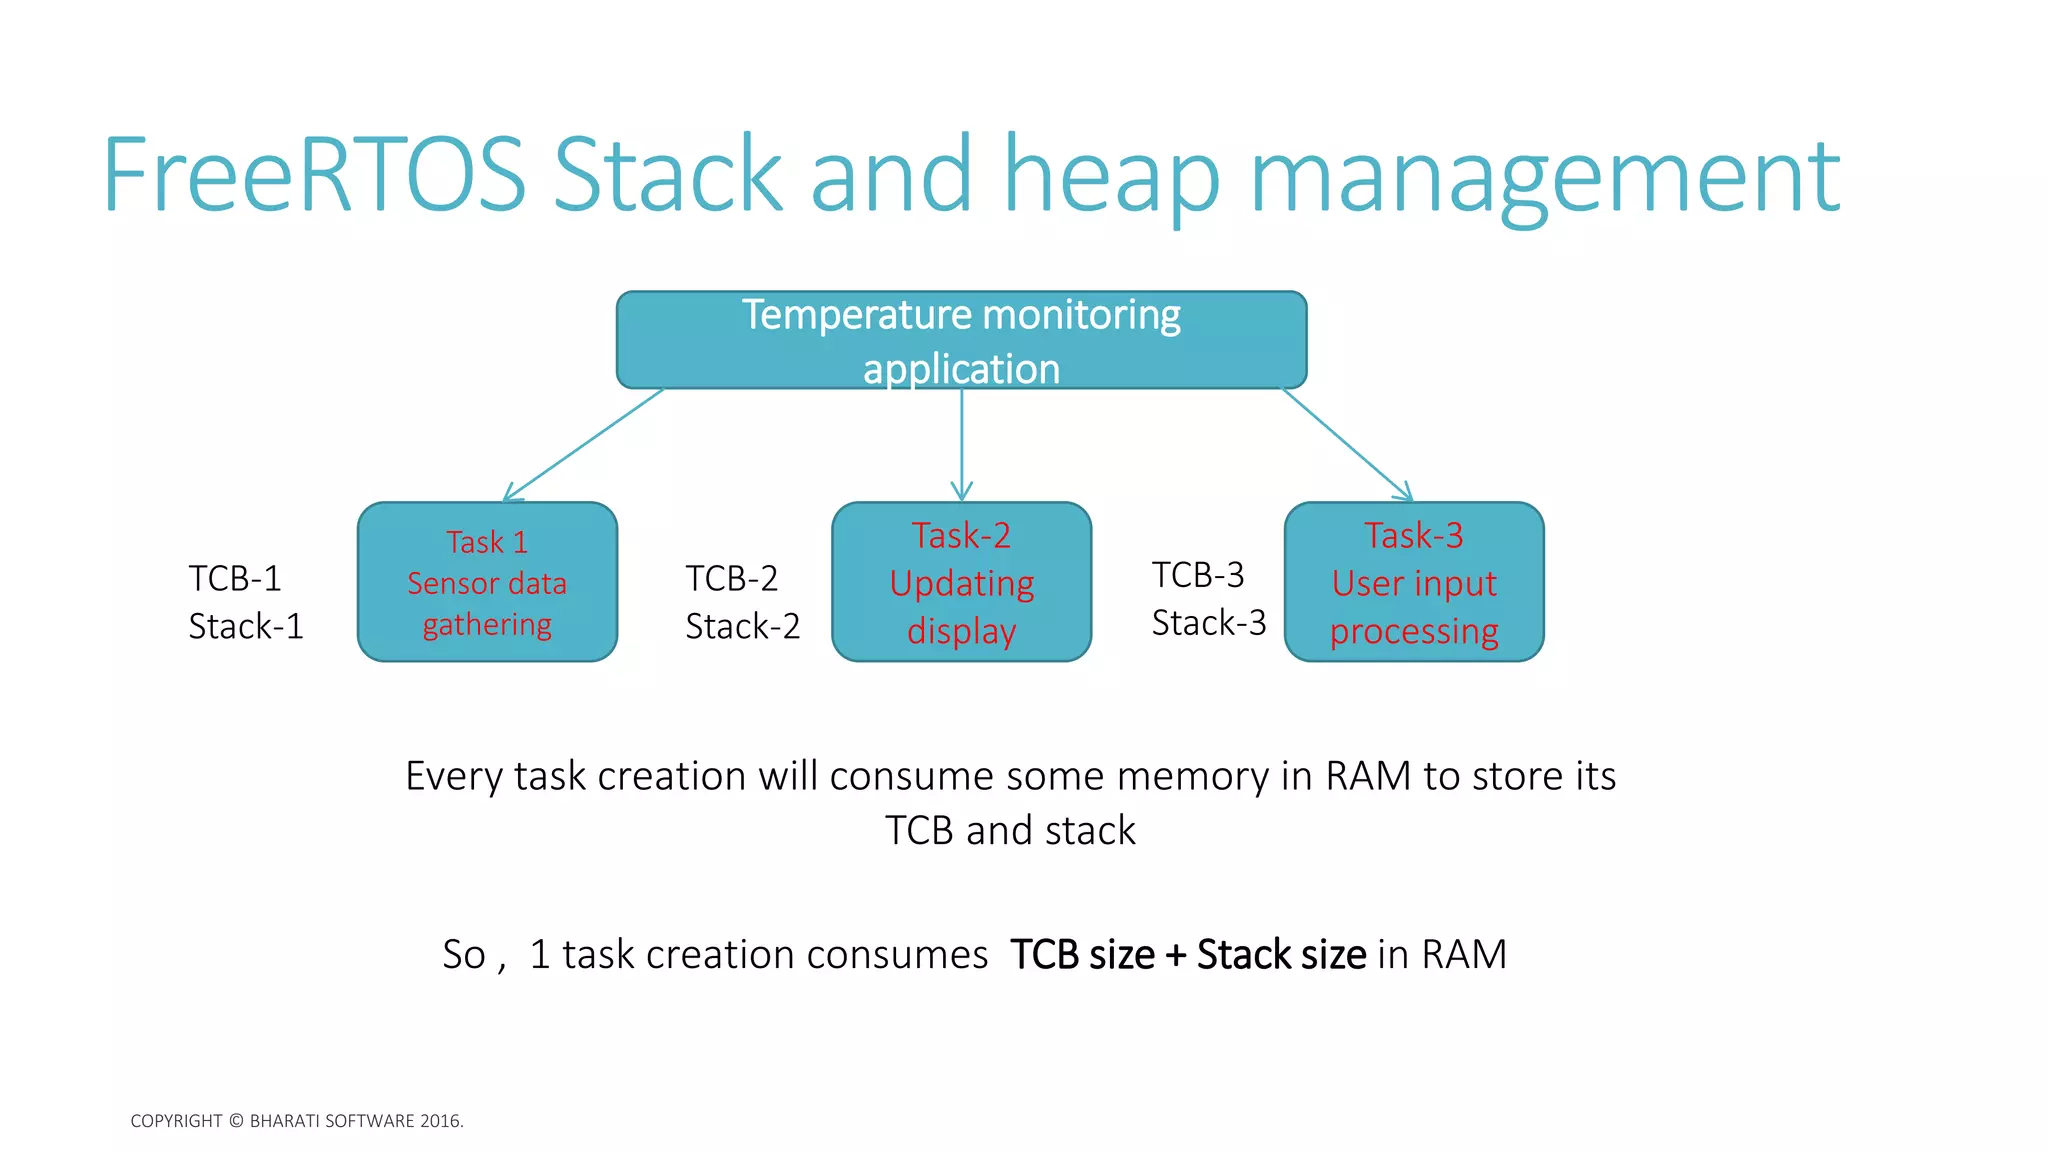
FreeRTOS provides excellent tools for runtime stack overflow detection and analysis.
Enabling Stack Overflow Detection
FreeRTOS can automatically check for stack overflows on every context switch. You can enable this feature in FreeRTOSConfig.h.
STM32-Cube IDE- FreeRTOS Memory Management part 2
The article 'STM32-Cube IDE- FreeRTOS Memory Management part 2' by Kalapi Infotech explains how to configure FreeRTOS for stack overflow detection.
Read the section 'Stack Overflow Detection'. It details the two methods (configCHECK_FOR_STACK_OVERFLOW = 1 and configCHECK_FOR_STACK_OVERFLOW = 2) and introduces the vApplicationStackOverflowHook callback function.
For robust detection, Method 2 is strongly recommended. When an overflow is detected, the RTOS will call the vApplicationStackOverflowHook() function. This is where you can put your debugging code, such as printing an error message, blinking a "fault" LED, or resetting the device.
Practical Task:
- Open your
FreeRTOSConfig.hfile (found underMiddlewares/Third_Party/FreeRTOS/Source/include). - Set
configCHECK_FOR_STACK_OVERFLOWto2. - Add the following
vApplicationStackOverflowHookfunction to yourmain.c:
/* In main.c, outside of any other function */

void vApplicationStackOverflowHook(TaskHandle_t xTask, char *pcTaskName)
{
   /* This function will be called if a stack overflow is detected. */
   printf("!!! STACK OVERFLOW DETECTED IN TASK: %s !!!\r\n", pcTaskName);

   // Halt the system for debugging. In a real product, you might log
   // the error and reset.
   while(1)
   {
       // Toggle an LED rapidly to indicate a fatal error
       HAL_GPIO_TogglePin(GPIOC, GPIO_PIN_13);
       HAL_Delay(100);
   }
}
Measuring Stack Usage with High Water Mark
How do you know if a task's stack is almost full? FreeRTOS provides the uxTaskGetStackHighWaterMark() function. It returns the minimum amount of free stack space (in words) that a task has had since it was created. A low water mark is a strong warning sign that you need to increase that task's stack size.
STM32-Cube IDE- FreeRTOS Memory Management part 2
The same Kalapi Infotech article also provides a practical guide on using the high water mark function.
Read the section 'Use of uxTaskGetStackHighWaterMark()'. It shows how to enable the feature and provides a code snippet demonstrating its use. This is a primary tool for tuning your task stack sizes.
4. Advanced Debugging: From HardFault to Root Cause
Sometimes, a stack overflow won't be caught by the FreeRTOS hook. A severe corruption can smash critical data so badly that the CPU triggers a HardFault before the RTOS scheduler can even run its check. When you halt the debugger, you'll find yourself inside the generic HardFault_Handler with a meaningless call stack.
This is where professional-grade debugging techniques are required to analyze the CPU's fault registers and manually reconstruct the state of the system at the moment of the crash.
How to Debug HardFaults on ARM Cortex-M MCUs
The presentation 'How to Debug HardFaults on ARM Cortex-M MCUs' by Memfault is an expert-level walkthrough of this exact scenario. It directly addresses how to identify that a fault was caused by a stack issue.
This video contains dense, highly valuable information. Fault Registers (06:05 - 09:45): Watch this section to understand the CFSR (Configurable Fault Status Register). Pay close attention to the mention of bits that indicate stacking errors. This is the hardware telling you the stack was involved in the crash. Stack Overflow Example (29:38 - 31:54): This is the key segment. The presenter debugs a fault that was caused by a stack overflow in a FreeRTOS task. Notice how the debugger initially points to an RTOS function, but further analysis reveals the recursive application function that was the true cause. This is a powerful demonstration of real-world debugging.
This technique of analyzing fault registers is what separates a junior developer from a senior one. When your program ends up in HardFault_Handler, checking the CFSR for stacking error flags should be one of your first steps.
Conclusion
In this lesson, you've explored the dangerous world of stack overflows and armed yourself with a suite of tools to combat them.
Key Takeaways:
- Stack overflows are caused by deep recursion or large local variables and lead to data corruption and system crashes.
- Static Analysis (STM32CubeIDE's Static Stack Analyzer with
-fstack-usage) helps you estimate stack requirements before runtime. - In FreeRTOS, each task has its own stack. You can enable
configCHECK_FOR_STACK_OVERFLOWand implementvApplicationStackOverflowHookfor robust runtime detection. - The
uxTaskGetStackHighWaterMark()function is essential for monitoring and tuning the stack size of each task. - When a
HardFaultoccurs, analyzing the CPU's fault registers (CFSR) can reveal if a stacking error was the root cause, allowing you to begin a more focused investigation.
Properly sizing and monitoring your stack(s) is not optional; it is fundamental to building reliable and professional embedded firmware.
Preview of the Next Lesson:
With our system now more stable and robust against memory issues, we can turn our attention to efficiency. The next module, Power Management and Optimization, will begin by teaching you how to identify and use the MCU's different low-power modes to drastically reduce energy consumption—a critical requirement for battery-powered and automotive applications.