Hello! Welcome to your final lesson in our module on Probability and Statistics.
In our last session, we focused on calculating numerical summaries of data, like the mean, median, and standard deviation, using Pandas. These numbers give us a precise, quantitative understanding of our data's center and spread. Today, we'll bring those numbers to life by learning how to visualize them. Visualizations are a cornerstone of Exploratory Data Analysis (EDA) because they allow us to see patterns, distributions, and relationships in our data at a glance.
Your learning outcome for this lesson is to create and interpret histograms, box plots, and scatter plots using Matplotlib and Seaborn. We'll cover:
- Histograms: To visualize the distribution of a single variable.
- Scatter Plots: To investigate the relationship between two variables.
- Box Plots: To summarize a distribution and compare it across different groups.
These three plot types are fundamental tools for any data scientist and will be essential for your GATE preparation.
1. Introducing Seaborn: Making Data Visualization Easier
Python has a powerful foundational plotting library called Matplotlib. While it can create almost any plot imaginable, the code can sometimes be verbose. Seaborn is another library built on top of Matplotlib. It's specifically designed for creating attractive and informative statistical graphics with much simpler code. For our purposes, we'll primarily use Seaborn.
Let's start by seeing how to set up your environment and load some data for plotting.
Seaborn Is The Easier Matplotlib
The video 'Seaborn Is The Easier Matplotlib' by NeuralNine provides a quick introduction to Seaborn and demonstrates how to load built-in datasets, which we'll use for our examples.
Watch from the beginning until 03:41. Focus on understanding what Seaborn is, how it relates to Matplotlib, and how to load a dataset like 'tips'. We'll be working with this 'tips' DataFrame in our lesson. You can follow along in a Jupyter Notebook if you like.
As you saw, the basic setup involves importing the libraries and loading a dataset into a Pandas DataFrame:
# The standard way to import these libraries
import seaborn as sns
import matplotlib.pyplot as plt

# Load a built-in dataset from Seaborn
tips = sns.load_dataset("tips")

# Display the first few rows to see what it looks like
print(tips.head())
2. Histograms: Visualizing a Variable's Distribution
Remember how we calculated the mean and standard deviation in the last lesson? A histogram lets you see that information. It shows the shape of your data's distribution, making it easy to spot if the data is symmetric (like a Normal distribution) or skewed.
A histogram works by grouping data into intervals or "bins" and then plotting the number of data points that fall into each bin.
Let's see how to create one.
Seaborn Is The Easier Matplotlib
Let's continue with the NeuralNine video to see how to create a histogram with Seaborn's histplot function.
Watch from 05:35 to 07:15. Pay attention to how sns.histplot() is used to visualize the distribution of the 'tip' column. Notice the effect of changing the bins parameter and adding a Kernel Density Estimate line with kde=True.
As the video shows, creating a histogram is straightforward:
# Create a histogram of the 'total_bill' column
sns.histplot(data=tips, x="total_bill", bins=20, kde=True)
plt.show() # This command displays the plot
How to Interpret a Histogram:
- X-axis: Shows the values of the variable (e.g., total bill amount).
- Y-axis: Shows the frequency (count) of observations within each bin.
- Shape: Look at the overall shape. Is it tall in the middle and short on the sides (symmetric)? Or is there a long "tail" to one side (skewed)? In our
total_billexample, we can see a "right skew," meaning most bills are on the lower end, with a few very high bills pulling the tail to the right.
3. Scatter Plots: Visualizing Relationships Between Two Variables
What if you want to know if two variables are related? For example, do people with higher total bills also leave higher tips? A scatter plot is the perfect tool for this. It places a dot for each data point on a 2D graph, with one variable on the x-axis and another on the y-axis.
Seaborn Is The Easier Matplotlib
The NeuralNine video provides an excellent example of creating and enhancing a scatter plot to explore the relationship between 'total_bill' and 'tip'.
Watch from 03:41 to 05:35. Notice how a simple scatter plot is created with sns.scatterplot(). Pay close attention to how the hue parameter is used to add a third, categorical dimension (the day of the week) to the plot, represented by color. This is a very powerful feature.
How to Interpret a Scatter Plot:
- Positive Correlation: If the dots generally trend upwards from left to right, it indicates a positive relationship (as one variable increases, the other tends to increase). You can see this clearly in the
total_billvs.tipplot. - Negative Correlation: If the dots trend downwards from left to right, it's a negative relationship.
- No Correlation: If the dots are scattered randomly with no clear trend, there is likely no relationship.
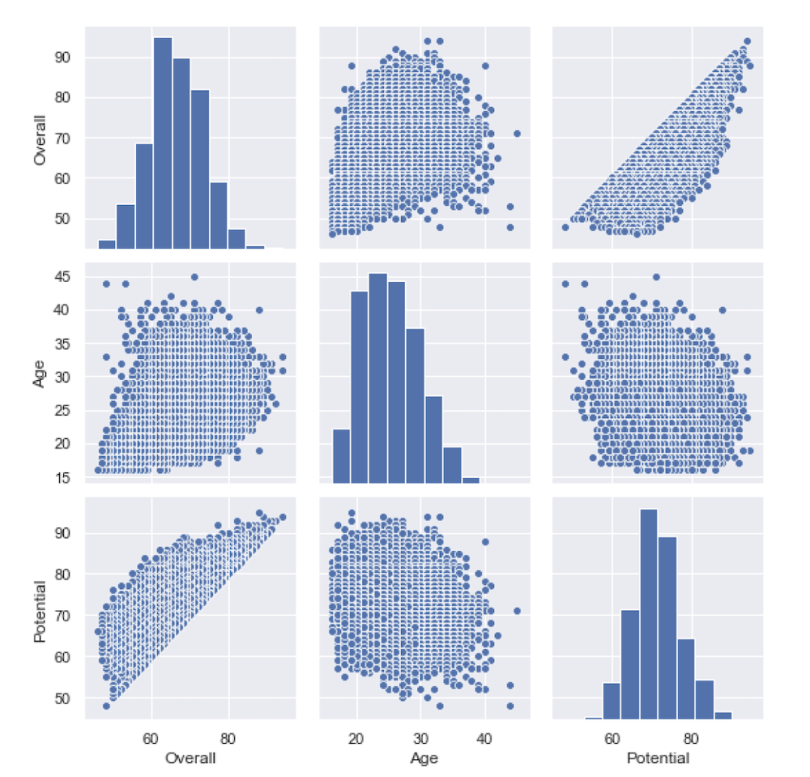
A common and powerful way to quickly view the distributions and pairwise relationships of multiple variables is with a pair plot.
4. Box Plots: Summarizing Distributions and Finding Outliers
In the last lesson, you used .describe() to get a five-number summary (min, 25%, 50%, 75%, max). A box plot (or box-and-whisker plot) is a visual representation of that exact summary. It's incredibly useful for seeing a variable's spread and identifying potential outliers.
Before we create one, let's understand its components.
Python Seaborn - 4 | Understanding and Creating BOX PLOT using Seaborn Library in Python
The video 'Understanding and Creating BOX PLOT' from the Learnerea channel gives a very clear and detailed breakdown of all the parts of a box plot.
Watch from 00:47 to 02:22. This short clip will precisely define the median, quartiles, whiskers, and outliers on a box plot diagram. This is crucial for interpretation.
This image perfectly illustrates how the shape of a histogram relates to the resulting box plot.

Now, let's see how to create and use box plots, especially for comparing distributions across different categories.
Python Seaborn Tutorial For Beginners: Start Visualizing ...
The 'Python Seaborn Tutorial For Beginners' from DataCamp provides concise code examples for creating box plots.
Read the section titled 'Seaborn box plots'. Pay attention to the code for creating a simple box plot and how the 'hue' parameter is used again to add another layer of comparison (e.g., comparing total bills by day, split by meal time).
A common use case for a box plot is to compare a numerical variable across different groups of a categorical variable. For example, let's compare the distribution of total_bill for each day of the week.
# Create a box plot to compare total_bill across different days
sns.boxplot(data=tips, x="day", y="total_bill")
plt.title("Distribution of Total Bill by Day")
plt.show()
From this single plot, you can immediately compare the median bill, the range of typical bills (the box), and the presence of outliers for each day.
Test your understanding!
You are an analyst at a university and have a dataset of student grades. You want to answer three questions:
- What is the overall distribution of grades? Are they high, low, or normally distributed?
- Is there a relationship between the number of hours a student studies per week and their final grade?
- Do students in the 'Engineering' faculty have different grade distributions compared to students in the 'Arts' faculty?
For each question, which of the three plot types (Histogram, Scatter Plot, or Box Plot) would be most appropriate to use, and why?
Show answer
-
Histogram: To see the overall distribution of a single numerical variable (grades), a histogram is the best choice. It will show you the frequency of different grade brackets and reveal the shape of the distribution (e.g., symmetric, skewed).
-
Scatter Plot: To check the relationship between two numerical variables (hours studied vs. final grade), a scatter plot is ideal. It will help you visually determine if there's a positive, negative, or no correlation.
-
Box Plot: To compare the distribution of a numerical variable (grades) across different categories (faculties), a box plot is perfect. You could place 'faculty' on the x-axis and 'grades' on the y-axis to see side-by-side box plots for 'Engineering' and 'Arts', allowing for easy comparison of their medians, spreads, and outliers.
Conclusion
Fantastic work today! You have now moved from calculating statistics to visualizing them, a critical skill for anyone working with data. Visualizations make complex data intuitive and are your best friends during exploratory analysis.
Key Takeaways:
- Seaborn is a high-level library that simplifies the creation of statistical plots.
- Histograms are used to understand the distribution (shape, center, spread) of a single numerical variable.
- Scatter Plots are used to investigate the relationship or correlation between two numerical variables.
- Box Plots provide a five-number summary of a numerical variable, are excellent for identifying outliers, and are ideal for comparing distributions across different categories.
Preview of the Next Lesson:
You've now completed the module on Probability and Statistics! We've covered a lot, from theoretical distributions to practical data analysis with Pandas and Seaborn.
In the next module, we will switch gears and dive into Core Data Structures. The first lesson will be on analyzing algorithm efficiency using Big-O notation. As you start to write code to process and analyze data, it becomes crucial to understand how efficient that code is, especially when dealing with large datasets. Big-O notation is the language we use to describe that efficiency.