Hello! Welcome to the final lesson in our module on Multi-Core Programming Concepts.
Throughout this module, we've explored the fundamental challenges of multi-core software: ensuring mutual exclusion with spinlocks, enforcing memory ordering with barriers, maintaining data visibility with cache coherency, and enabling communication with IPC. These mechanisms are powerful, but they are also complex and prone to subtle bugs like race conditions, deadlocks, and data corruption. When things go wrong, how do you find the root cause in a system where multiple cores are executing in parallel?
This lesson will provide the answer by addressing the learning outcome: Configure and analyze a multi-core debugging session with synchronized execution control using a JTAG debugger. We will focus on the Lauterbach TRACE32 debugger, a tool you're already familiar with, and learn how to harness its advanced features for multi-core systems. This is the critical skill that allows you to observe, control, and untangle the concurrent operations happening inside the silicon.
1. The Challenge: Why Multi-Core Debugging is Different
In a single-core system, debugging is relatively straightforward. You can stop the core at a breakpoint, and the entire world freezes with it. You can inspect memory and registers, confident that you are seeing a consistent snapshot of the system's state.
This assumption breaks down in a multi-core environment.
Efficient debugging of multi-core MCUs
To understand the unique problems that arise, let's start with this article from EE News Europe. It provides an excellent overview of the challenges developers face when moving from single-core to multi-core development.
Please read the sections titled 'Challenges when changing over to multi-core MCUs' and the following two untitled sections that discuss the limitations of stop-and-go debugging (up to the heading 'Beyond stop and go'). Focus on these key points: How issues like inconsistent data (from caches) and deadlocks appear in multi-core systems. Why simply halting one core when it hits a breakpoint is not enough. The concept of 'cross triggering' and why on-chip debug hardware is crucial for achieving a synchronous stop.
As the article explains, if you stop only one core, the other cores continue running. By the time you manually halt them, the overall system state has changed, and the context of the original breakpoint is lost. The root cause of your bug may have been overwritten, or the system may now be in an entirely new, unrelated state.
This leads to the core requirement of multi-core debugging: synchronized run control. You need the ability to start, stop, and step multiple cores (or a specific group of cores) in unison, as if they were a single entity.
2. Multi-Core Debugging Architectures
Before configuring the debugger, you need to understand the model it uses. JTAG debuggers like Lauterbach TRACE32 typically support two main multi-core debugging paradigms: Asymmetric Multiprocessing (AMP) and Symmetric Multiprocessing (SMP). Your experience with AUTOSAR communication stacks and gateway development has likely exposed you to AMP systems, where different cores might run different operating systems or bare-metal applications.
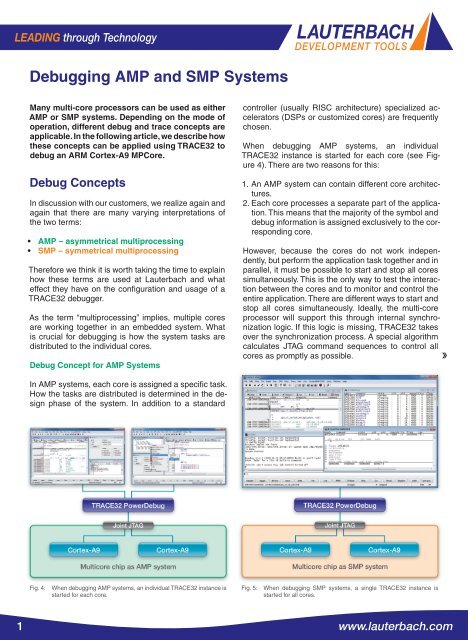
As the image shows:
- AMP Debugging: You launch a separate instance of the TRACE32 software for each core you want to debug. Each instance is configured for its specific core and application. This is the most common model for heterogeneous systems (e.g., Cortex-A + Cortex-M) or homogeneous systems running different software stacks.
- SMP Debugging: A single TRACE32 instance is launched with OS-awareness (e.g., for Linux or an SMP-aware RTOS). The debugger understands that the OS can schedule threads on any core and presents a unified view of the system.
For embedded driver development, you will most frequently encounter the AMP model, where you need to explicitly manage the debug session for each core.
3. Configuring a Multi-Core Debug Session
Setting up an AMP debug session involves three main steps:
- Hardware Connection: Connect the Lauterbach PowerDebug module to the target's JTAG port.
- Configuration Files (
config.t32): Prepare configuration files that tell each TRACE32 instance how to connect to its specific core. - Synchronization Script (
.cmm): Write a PRACTICE script to launch the TRACE32 instances and configure the synchronization between them.
The following guide is the definitive source for this process. We'll walk through the key parts.
The 'ICD Debugger User’s Guide' from Lauterbach is the primary reference for this topic. We will focus on the sections that explain how to configure multiple debugger instances to work together.
Please read the following sections. Don't worry about memorizing every detail; focus on understanding the overall concept and where to find the key settings. General Information (Page 14): Understand the distinction between multicore and multiprocessor debugging. Tool Configuration for Single Device Solution (Page 14): Note the CORE= setting. This is used when one debug box connects to multiple cores. Setup and Start of TRACE32 Software (Page 21): The key takeaway is that you need one TRACE32 instance per core. Config file settings for single device solution (Page 22): See how the PBI=CORE=<n> setting is used in the config.t32 file. Config file settings for both single and multi device solutions (Page 22-23): This is critical. Note the IC=NETASSIST PORT=<port_number> setting. This opens a communication port for each debugger instance, allowing them to talk to each other. Example: Static config files... (Page 23-24): Review the two example config.t32 files. See how one is configured for CORE=1 with PORT=20002, and the other for CORE=2 with PORT=20001. They are set up to communicate with each other. Example: start of further TRACE32 instances... (Page 26): This shows a powerful technique: one main script can launch the other core's debugger instance using the OS command.
Summary of Configuration
To set up a debug session for a dual-core AMP system, you would typically have:
-
config_core0.t32:PBI= CORE=1 // This instance targets the first core USB IC= NETASSIST PORT=20001 // Opens a port for Core 1's debugger to connect to -
config_core1.t32:PBI= CORE=2 // This instance targets the second core USB IC= NETASSIST PORT=20002 // Opens a port for Core 0's debugger to connect to -
A master script (
startup.cmm) to launch and synchronize everything.
4. Implementing Synchronized Execution Control
With the instances configured to communicate, you can now establish synchronized run control. This is done using the SYnch command group in a PRACTICE script.
One core is designated the master, and the others are slaves.
- When the master starts, all slaves with
SlaveGoenabled will also start. - When the master breaks (hits a breakpoint, is manually halted), all slaves with
SlaveBrkenabled will also break.
Let's return to the 'ICD Debugger User’s Guide' to see exactly how to implement this master/slave synchronization.
Please study these two crucial sections: Start Stop Synchronisation Settings (Pages 34-35): This section introduces the SYnch.Connect, MasterGo/MasterBrk, and SlaveGo/SlaveBrk commands. Summary (Example with one master and two slave core debuggers) (Page 36): This is a complete script. Analyze how it uses InterCom.execute to send synchronization commands from the master instance to the slave instances.
Here is a simplified version of a startup script for a dual-core system, which you would run from the TRACE32 instance for Core 0:
// startup_core0.cmm

// 1. Launch the TRACE32 instance for Core 1
OS.Task t32marm -c config_core1.t32 -s startup_core1.cmm

// 2. Wait for Core 1's debugger to be ready (it will have opened port 20002)
InterCom.WAIT localhost:20002

// 3. Configure this instance (Core 0) as the MASTER
SYnch.RESet
SYnch.Connect localhost:20002  // Connect to Core 1's debugger
SYnch.MasterGo ON
SYnch.MasterBrk ON

// 4. Configure the other instance (Core 1) as the SLAVE
//    Use InterCom to send commands to the other TRACE32 instance
InterCom.execute localhost:20002 "SYnch.RESet"
InterCom.execute localhost:20002 "SYnch.Connect localhost:20001" // Connect back to me
InterCom.execute localhost:20002 "SYnch.SlaveGo ON"
InterCom.execute localhost:20002 "SYnch.SlaveBrk ON"

// Now, when you press "Go" in the Core 0 window, Core 1 will also run.
// When a breakpoint is hit on either core, both will stop.
5. Analyzing a Multi-Core Session
Now that you can synchronously control the cores, you can effectively analyze their behavior. A multi-core debug session provides a window into all concurrent activities.
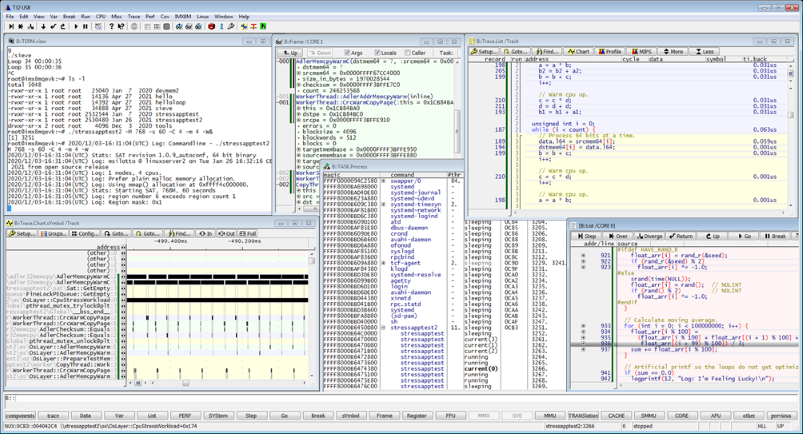
With this setup, you can perform powerful debugging actions:
- Global Breakpoints: When a breakpoint is hit on Core 0, Core 1 stops simultaneously. You can then inspect the call stack, registers, and memory of both cores to understand the exact state of the entire system at the moment the breakpoint was hit.
- Cross-Core Analysis: Imagine debugging the IPC mechanism from our last lesson. You can set a breakpoint on Core 0 just after it triggers the SGI, and another breakpoint in the SGI's ISR on Core 1. Running the system will instantly tell you if the interrupt is being delivered and handled.
- Conditional, Core-Specific Breakpoints: You can set advanced breakpoints that only trigger for a specific task or thread on a specific core.
Debug your Embedded system using Lauterbach
This video from Nohau Solutions demonstrates some of these advanced debugging techniques. While it focuses on an SMP Linux system, the principles of setting conditional and task-specific breakpoints are directly applicable to AMP debugging as well.
Watch these two segments to see the analysis capabilities in action: Debugging Multiple Processes (17:33 - 28:37): Pay attention to how the debugger can distinguish between tasks (even if they run the same code) and set breakpoints that are specific to a single task/thread ID. Advanced Breakpoints (28:37 - 33:24): Observe how you can set breakpoints on memory access (watchpoints) and trigger them based on specific data values or conditions. Imagine applying these techniques: you could set a write-watchpoint on a shared memory location and have the system halt only when a specific core writes an erroneous value to it.
Test your understanding!
You are debugging a multi-core system where you suspect a race condition is corrupting a global variable in shared memory. Core 0 and Core 1 both write to this variable. How would you use a synchronously-controlled JTAG debugger to find out which core is responsible for the corruption?
Show answer
- Set up Synchronized Run Control: First, configure the debug session for both cores with a master/slave synchronization script, ensuring
MasterBrkandSlaveBrkare enabled. This guarantees that when one core stops, the other stops immediately. - Set a Watchpoint: In the debugger, set a hardware data breakpoint (a "watchpoint") on the memory address of the corrupted global variable.
- Add a Condition: Configure the watchpoint to trigger only when an incorrect or unexpected value is written to the variable.
- Run and Analyze: Run the system. When one of the cores performs the corrupting write, the watchpoint will be hit, and the debugger will halt all synchronized cores.
- Identify the Culprit: The debugger window for the core that triggered the watchpoint will be active, showing the exact instruction that performed the write. You can then inspect its call stack to understand the context and find the bug in the source code. By inspecting the other core's state, you can understand what it was doing at the same time, which may be crucial for understanding the race condition.
Interview Corner
Q1: You suspect a deadlock where Core 0 is waiting for a resource held by Core 1, and Core 1 is waiting for a resource held by Core 0. How would you use a JTAG debugger like Lauterbach to confirm this?
A: I would first establish a synchronized multi-core debug session. Then, I would manually halt the master core. Due to synchronization, the slave core would also halt. I would then inspect the call stack of both cores. If Core 0 is stuck in a while() loop or spinlock waiting for a flag A, I would check the code to see that this flag is supposed to be released by Core 1. Then I'd examine Core 1's call stack. If it's similarly stuck waiting for a flag B that is supposed to be released by Core 0, I have confirmed the deadlock. The synchronized halt gives me the critical, simultaneous snapshot of both cores' states needed to prove the circular dependency.
Q2: What is "synchronous run control," and why is it essential for multi-core debugging?
A: Synchronous run control is the ability of a debugger to start, stop, and step multiple processor cores in unison. It's essential because multi-core bugs, like race conditions and deadlocks, depend on the precise timing and interaction between cores. Without it, if you stop one core at a breakpoint, the others continue running, changing the system state and making it impossible to analyze the exact conditions that led to the bug. Synchronous control freezes the entire system at a point in time, preserving the state of all cores for a consistent and meaningful analysis.
Q3: You're setting up a Lauterbach session for a dual-core AMP system. What are the key settings you need in your configuration files (.t32) and your startup script (.cmm)?
A:
- In the configuration files (
config_core0.t32,config_core1.t32):PBI=CORE=<n>: Each file needs to specify which core its debugger instance will attach to (e.g.,CORE=1for the first,CORE=2for the second).IC=NETASSIST PORT=<port>: Each instance must open a unique TCP/IP port for inter-debugger communication. For example, Core 0's config might usePORT=20001and Core 1's might usePORT=20002.
- In the startup script (
startup.cmm):- The script for the master core (e.g., Core 0) needs to launch the slave's debugger instance, typically using the
OS.Taskcommand. - It must use
SYnch.Connectto connect to the port opened by the slave debugger (e.g.,SYnch.Connect localhost:20002). - It configures itself as master using
SYnch.MasterGo ONandSYnch.MasterBrk ON. - It uses
InterCom.executecommands to send configuration commands to the slave instance, telling it to connect back (SYnch.Connect localhost:20001) and to act as a slave (SYnch.SlaveGo ON,SYnch.SlaveBrk ON).
- The script for the master core (e.g., Core 0) needs to launch the slave's debugger instance, typically using the
Conclusion
This lesson concludes our deep dive into multi-core programming. We've journeyed from the hardware foundations of cache coherency and memory barriers to the software constructs for synchronization and communication. Today, you learned how to master the tool that ties it all together: the multi-core debugger.
Key Takeaways:
- Multi-core debugging requires synchronized run control to capture a consistent system state.
- In an AMP system, you typically run one debugger instance per core.
- Configuration involves telling each instance which core to attach to (
PBI=CORE=n) and opening a communication channel (IC=NETASSIST PORT=...). - Synchronization is achieved via a master/slave model configured with the
SYnchandInterComcommands in a PRACTICE script. - With a synchronized session, you can use global breakpoints and conditional watchpoints to effectively find and analyze complex multi-core bugs like race conditions and deadlocks.
Next Module Preview:
You have now built a formidable understanding of the low-level workings of modern ARM cores. We will now move up one layer of abstraction. The next module, AUTOSAR MCAL Development, will show you how these hardware features are controlled and exposed through the standardized interfaces of the AUTOSAR Microcontroller Abstraction Layer. Your knowledge of registers, interrupts, and peripherals will provide an excellent foundation for understanding and implementing MCAL drivers like Port, Dio, and Mcu.