Introduction
In our last session, we constructed a detailed data collection plan for your capstone project, covering participant recruitment, the design of round-robin and baseline instruments, data security protocols, and a procedural timeline. We now have a clear blueprint for what data to collect and the overall process for gathering it.
This lesson sharpens our focus onto a critical logistical and methodological challenge: designing the measurement schedule itself. Our objective is to develop a schedule that balances the statistical demand for rich, high-frequency data against the very real human factors of participant fatigue and the complex coordination required within a triad. We will explore how to determine the optimal frequency, duration, and timing of your measurements, particularly for the Experience Sampling Method (ESM) logs we previously outlined. You will learn to frame this challenge as an optimization problem, a perspective that should align well with your background in operations research.
Part 1: Deconstructing the Measurement Schedule: The Three D's of ESM
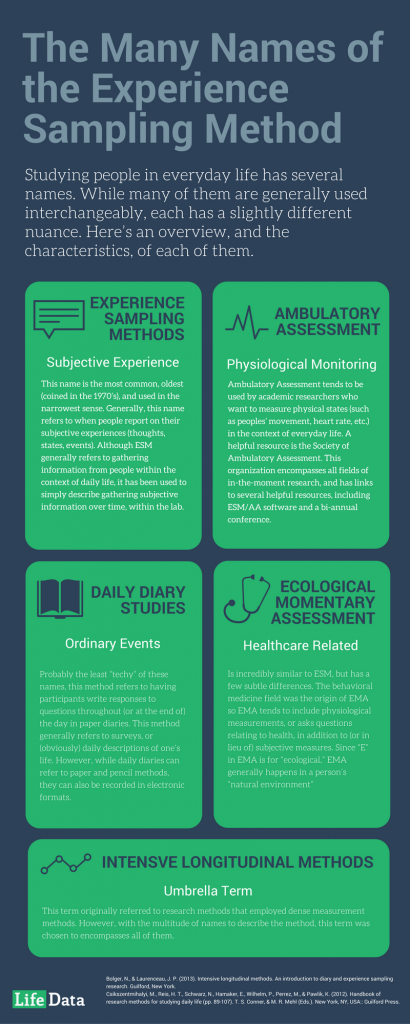
Before diving into scheduling specifics, it's useful to clarify some terminology. Experience Sampling Method (ESM), Ecological Momentary Assessment (EMA), and other related terms are often used interchangeably to describe methods for studying people in their daily lives.
At the heart of designing an ESM study is a fundamental trade-off. To capture the complex, fluctuating emotional dynamics of a triad, we ideally want as much data as possible. However, every survey prompt is an intrusion, and too many requests can lead to participant burnout, poor data quality, or dropouts.
A useful framework for navigating this trade-off is the "Three D's" of ESM design: Density, Depth, and Duration. The following video provides an excellent explanation of these concepts and the factors to consider when balancing them.
Ecological Momentary Assessment to Measure Emotion, Cognition, and Behavior in Daily Life | DIGIT-MI
This clip from a talk by Dr. Amy Funabashi on Ecological Momentary Assessment introduces a powerful framework for making design decisions in intensive longitudinal studies.
Please watch the segment from this point. The speaker outlines the "Three D's"—Density, Depth, and Duration—and discusses the key considerations for balancing them: the nature of the phenomenon you're studying, the characteristics of your population, and your analytical goals. Pay close attention to her point about which of the three "D's" has the largest impact on participant compliance.
To summarize the key points from the video:
- Density: The frequency of assessments (e.g., number of surveys per day).
- Depth: The length of each assessment (e.g., number of items in each survey).
- Duration: The total length of the data collection period (e.g., number of days or weeks).
The crucial insight here is that while we often worry most about survey length (depth) and frequency (density), research shows that overall study duration is the single biggest factor affecting compliance. Participants are often willing to tolerate dense and relatively deep sampling for a short period, but their engagement drops significantly as the study stretches over many weeks or months. This has major implications for your research, which aims to understand processes that unfold over time.
Part 2: Time-Based vs. Event-Based Sampling: When to Measure?
Now that we have the "Three D's" framework, let's consider the specific timing of your measurements. How do you decide when to prompt participants for a response? The two primary approaches are time-based sampling and event-based sampling.
The following resource provides a detailed comparison of these methods.
Intensive Longitudinal Data Analyses and Sample Size ...
This excerpt from a doctoral dissertation clearly categorizes and explains the different types of intensive longitudinal methods, outlining the pros and cons of each approach.
Please read the section titled "Intensive Longitudinal Method," which starts on page 13. Focus on the descriptions of time-based vs. event-based designs, the discussion of Daily Diary vs. EMA/ESM, and the section on ILM selection. This will clarify the strengths and weaknesses of different scheduling strategies.
Here's a breakdown of the sampling strategies and how they apply to your study:
-
Time-Based Sampling: Prompts are sent according to a schedule set by the researcher.
- Fixed: Prompts at the same times every day (e.g., 9 AM, 3 PM, 9 PM). This is simple but risks repeatedly sampling the same contexts (e.g., always during a work break).
- Random: Prompts are sent at completely random times within a waking window. While this offers the purest sample of a person's day, it's impractical as it can lead to clusters of surveys followed by long gaps.
- Semi-Random (or Stratified Random): This is the most common and practical approach. The day is divided into blocks (e.g., morning, afternoon, evening), and one random prompt is sent within each block. This ensures coverage across the day while maintaining an element of unpredictability.
-
Event-Based Sampling: Prompts are initiated by the participant in response to a pre-defined event. The researcher doesn't send a signal; the participant is trained to complete a survey whenever the event occurs.
A Hybrid Strategy for Your Triadic Study
For your research, a purely time-based or event-based approach would be insufficient. A hybrid strategy will yield the most valuable data:
-
Semi-Random Time-Based Prompts: This will form the backbone of your data collection. You could schedule 4-6 prompts per day, stratified into 2-3 hour blocks (e.g., 9am-12pm, 12pm-3pm, etc.). This provides a continuous stream of data on each individual's baseline emotional state (jealousy, guilt, mood), allowing you to model within-day variability and emotional inertia.
-
Event-Based Prompts: This layer captures the specific, causally-relevant events you are most interested in. You would instruct all three participants to complete a specific, brief "Event Log" at key moments, such as:
- Immediately before and after a planned encounter between the wife and bull.
- Immediately after a significant conversation between the husband and wife about the lifestyle.
- Following any instance of conflict or strong disagreement related to the lifestyle.
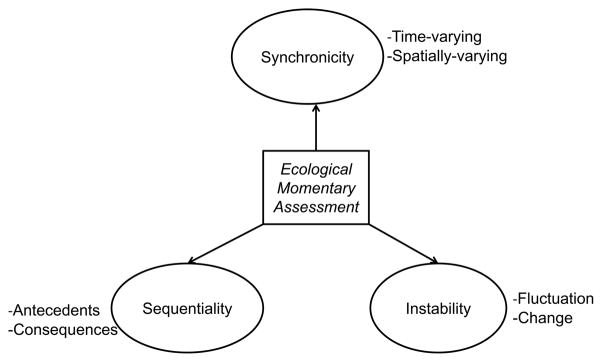
This hybrid approach allows you to capture both the general emotional "weather" of the triad and the acute "storms" triggered by specific events, providing the necessary data for the causal models you plan to build. The diagram below illustrates how this method is suited to studying the antecedents, consequences, and fluctuations of relational dynamics.
Part 3: A Quantitative Framework for Balancing Richness and Burden
The decision of how to set your "Three D's"—especially the number of participants/triads (N) and the number of measurements (T)—can be formalized. Given your background in Operations Research, you can conceptualize this as an optimization problem: how to maximize statistical power for a given level of "cost," where cost is a proxy for financial expense, participant burden, and researcher effort.
A recent paper outlines exactly this approach, proposing the use of a cost function within a power analysis framework. This allows you to move beyond qualitative trade-offs and make data-informed decisions about your study design.
[PDF] Cost-effective ESM studies: Integrating budget constraints into ...
This paper provides a sophisticated yet practical method for integrating budget and burden constraints directly into sample size planning for ESM studies. It formalizes the decision-making process in a way that is highly relevant to your statistical background.
Please read the section titled "Step 4: The ESM cost function" (pages 13-18). Focus on understanding the components of the cost function: The definition of the four terms. The breakdown of each cost component (fixed, participant, measurement occasion). The explanation of the Incentive function and how it incorporates expected compliance. Finally, study the section on adding cost information to a power contour plot, and review Figure 5, which visualizes the output.
The core idea is to express the total study "cost" as a function of N (number of triads) and T (total measurements per person):
Where:
- = Fixed costs (e.g., software licenses, your time for study design).
- = Per-triad costs (e.g., time for onboarding and debriefing sessions).
- = Per-measurement costs (e.g., time for data monitoring, participant support).
- = The incentive function, which models participant compensation, often incorporating bonuses for high compliance.
By simulating power across different combinations of N and T and overlaying the "cost" of each combination, you can generate a plot like Figure 5 in the paper. This allows you to answer two key questions:
- To achieve my desired power (e.g., 80%), what is the most cost-effective combination of N and T? (This is the red dot in the figure).
- Given my maximum budget/burden tolerance, what combination of N and T maximizes my statistical power? (This is the blue dot).
While you won't run these complex simulations now, this framework provides a rigorous way to think about and justify your final measurement schedule.
Part 4: Practical Recommendations and Advanced Strategies
The optimization framework is powerful, but where do you start? What are reasonable values for N and T? Another simulation study provides some excellent rules of thumb.
Intensive Longitudinal Data Analyses and Sample Size ...
This dissertation provides invaluable, practical guidance on sample size requirements for intensive longitudinal studies, based on extensive Monte Carlo simulations.
First, quickly read the introduction to "Chapter Four: Sample Size Consideration" (page 52) to understand the setup. Then, read the subsection "Sample Size Considerations" under the "Discussion" section (pages 70-73), starting with the key finding about the relative importance of N vs. T. Pay close attention to the specific recommendations for N and T values required to achieve adequate power for small, medium, and large effect sizes.
The most critical takeaway from this research is that, for the types of multilevel models you will be using, increasing the number of triads (N) has a much greater impact on statistical power than increasing the number of measurements per person (T). There is a "ceiling effect" for T; after a certain point (e.g., T ≈ 75), adding more daily measurements yields diminishing returns.
This has a clear, practical implication for your study: if you face resource constraints, it is almost always better to recruit more triads for a shorter duration than to study fewer triads for a very long time.
Based on the findings in this resource, here are some starting points for your design:
- If you expect a large effect size (e.g., a strong link between an activity and guilt), you might achieve sufficient power with N ≈ 25-50 triads and T ≈ 25-50 total measurements per person.
- If you expect a medium effect size, your target should be higher, perhaps N ≥ 50-75 triads with T ≈ 50-75 measurements.
- Detecting small effects with ESM is notoriously difficult and would likely require a sample size (N > 200) that is unfeasible for this type of sensitive research.
The Measurement Burst Design
Finally, how can you collect data over a long period (e.g., a year) to study long-term adaptation without burning out your participants? The measurement burst design is an elegant solution.
Instead of continuous daily sampling for months on end, you conduct short, intense "bursts" of data collection separated by longer breaks.
- Example Schedule: Collect ESM data for 7 consecutive days each month for a period of 6 or 12 months.
This approach keeps participants engaged during the short bursts and dramatically reduces the overall burden, making long-term longitudinal research feasible. It provides high-density snapshots of the triad's dynamics at multiple points in time, allowing you to model changes in emotional reactivity, habituation, or sensitization over the long run.
Conclusion
In this lesson, we have moved from a general timeline to a sophisticated, evidence-based measurement schedule. You are now equipped to make principled decisions about the timing, frequency, and duration of your data collection, ensuring you can capture the rich dynamics of the triad without overwhelming your participants.
Key Takeaways:
- The Three D's: A robust ESM schedule requires a deliberate balance between Density (frequency), Depth (length), and Duration (total time), with duration being the most critical factor for compliance.
- Hybrid Sampling: A combination of semi-random time-based sampling (for baseline dynamics) and event-based sampling (for key causal moments) is the ideal strategy for your study.
- Optimization Framework: The trade-off between data richness and participant burden can be formalized using a cost function, allowing you to identify the most efficient combinations of N (triads) and T (measurements).
- N is More Important than T: For statistical power, prioritize recruiting more triads over adding an excessive number of measurements per day.
- Measurement Bursts: To study long-term change, use a measurement burst design (e.g., one week of sampling per month) to maintain high data quality and participant engagement.
In our final capstone lesson, we will synthesize everything we have covered in this course. You will construct a coherent causal narrative that integrates evidence from all selected models to explain the emotional dynamics of the triad, effectively creating the complete research proposal for your groundbreaking study.