In our last lesson, we explored how to specify models that can accommodate the reality that causal effects are not always static. We moved from the assumption of a single, fixed coefficient () to the more flexible concept of a time-varying coefficient function (), introducing the Time-Varying Effect Model (TVEM) as a powerful tool for this purpose.
Today, we shift from specification to interpretation. Our focus is to interpret time-varying effect patterns such as habituation, sensitization, or cyclical emotional responses. Once you have fit a TVEM and have a plot of your coefficient function, what story does it tell? How do you translate that curve into a meaningful insight about the emotional dynamics of your triad? This lesson will equip you with the conceptual framework and practical skills to read these dynamic patterns and understand their implications for your research.
The Psychology of Changing Responses
Before we dive into the statistical plots, let's establish a conceptual foundation for why effects change over time. Two key psychological processes, habituation and sensitization, often operate in tandem to shape our responses to repeated stimuli.
Dual Process Theory of Habituation and Sensitization
This video from the channel Psy vs. Psy provides a concise overview of the Dual Process Theory of habituation and sensitization.
Watch from the beginning to understand the core definitions of habituation and sensitization. Pay close attention to the explanation of the dual process theory, which posits that these two processes occur simultaneously. The video then distinguishes between the stimulus-specific SR system (habituation) and the more general state system (sensitization), using an experiment to show how the overall behavioral outcome is a net result of these two competing forces.
As the video explains, the observed behavior is a summation of the habituation and sensitization processes. In your context:
- Habituation could manifest as the husband's jealousy diminishing over repeated encounters, even if each encounter is similar. The stimulus (e.g., wife's date) becomes less potent over time.
- Sensitization could occur if repeated encounters, instead of dulling the response, actually heighten emotional sensitivity. For instance, the wife's guilt might build cumulatively with each date, or the husband's jealousy could be amplified by ruminative thoughts between encounters.
The key takeaway is that the change in an emotional response is not random; it's often the product of underlying, competing psychological mechanisms. Our statistical models are tools to reveal the net outcome of these processes.
From Parametric Curves to Dynamic Patterns
In the previous lesson, we touched on using polynomial terms (e.g., an interaction between an activity and time-squared) to model non-linear changes. This is a simple, parametric way to look for habituation or sensitization.
A significant negative quadratic effect, for example, would describe a curve that flattens out over time, suggesting diminishing returns or habituation. This is a common pattern in skill acquisition and therapeutic processes.
ACRM 2022 IC17: Longitudinal Data Analysis Using R: Part I Introductory Topics
This excerpt from a workshop by Dr. Keith Lohse explains how to model and interpret curvilinear trajectories using polynomials in mixed-effects models.
First, watch the conceptual introduction to curvilinear models, which explains how adding polynomial terms like "time squared" can create curves. Then, see how this is applied in the quadratic random slopes model, which allows each individual to have their own unique curvature. Finally, and most importantly for this lesson, focus on the section explaining how to interpret the fixed effects of the quadratic model. The speaker explains how a negative quadratic coefficient indicates a "slope that gets less positive over time," a classic pattern of diminishing returns.
While useful, this parametric approach forces the change to fit a specific shape (e.g., a parabola). For a more exploratory, data-driven approach, we turn to the non-parametric methods we introduced last time, which allow us to discover the shape of change.
Interpreting Time-Varying Effect Model (TVEM) Plots
The primary output of a TVEM is not a single number, but a set of plots showing how the intercept and slope coefficients change as a function of time.
Let's ground this in the foundational TVEM paper.
A Time-Varying Effect Model for Intensive Longitudinal Data
This paper provides a thorough introduction to TVEM, including clear examples of how to interpret the resulting coefficient functions.
Begin by reading the section that motivates the need for time-varying effects, "no man ever steps in the same river twice". This sets the conceptual stage. Next, study the conceptual overview of TVEM. Focus on understanding the meaning of the intercept function \beta_0(t) and the slope function \beta_1(t). The paper's interpretation of Figure 2 is crucial here. Finally, examine the simulated example. Pay close attention to Figure 4 and how the authors describe the model's success in recovering the true underlying shapes of the coefficient functions (exponential, quadratic, and sinusoidal).
The paper uses P-splines to estimate these functions. As you know from your statistical background, this is a method of flexible regression that approximates a smooth function using a series of basis functions, with a penalty to prevent overfitting. The result is a data-driven estimate of the coefficient's trajectory over time.
Let's look at the hypothetical coefficient functions from Figure 2 of the paper.
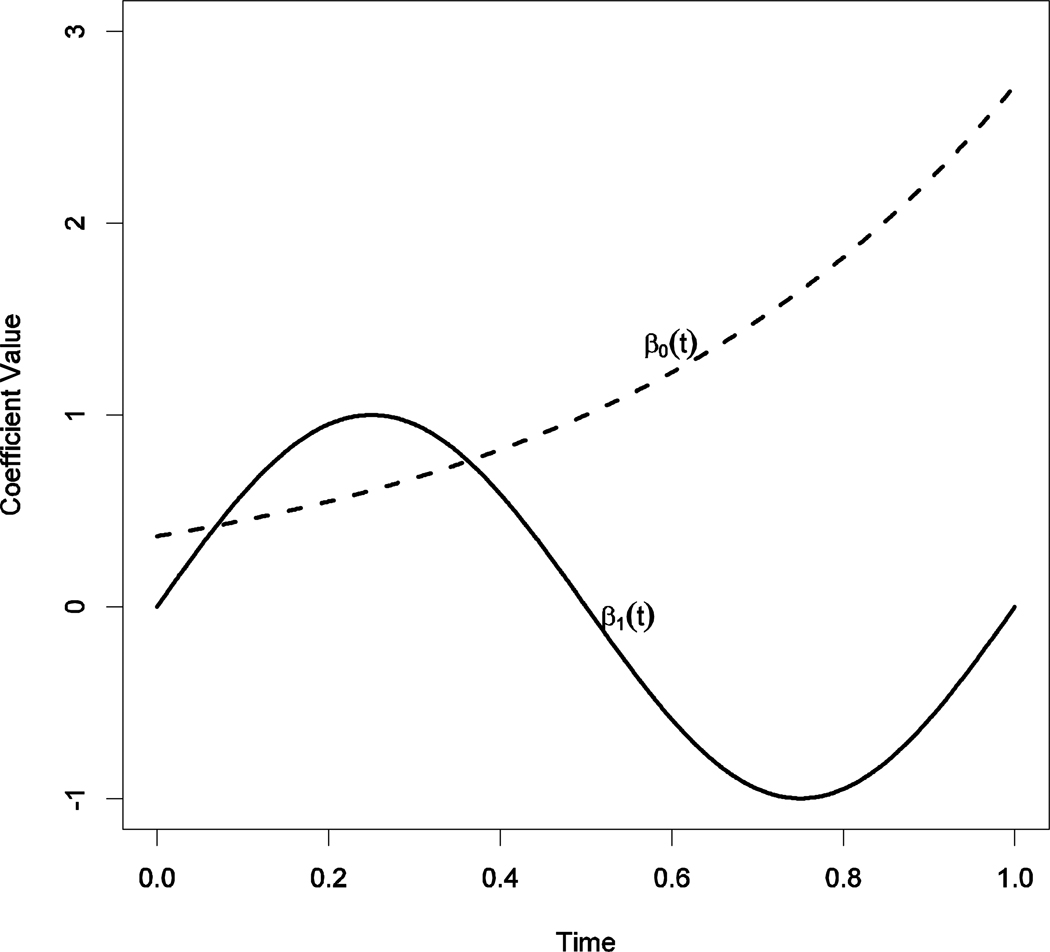
Here's how to interpret the solid line, , which represents the changing effect of a predictor X on an outcome Y:
- At
Time = 0.0, the slope is 0.Xhas no effect onY. - At
Time = 0.25, the slope reaches its peak at 1.0. This is whereXhas its strongest positive effect onY. - At
Time = 0.5, the slope is 0 again. The effect has vanished. - At
Time = 0.75, the slope reaches its minimum at -1.0. Here,Xhas its strongest negative effect onY. - At
Time = 1.0, the slope returns to 0.
This is a cyclical effect. In your research, this could model a "honeymoon and hangover" effect. For example, the effect of a communication intervention (the predictor) on relationship satisfaction (the outcome) might be initially positive, then fade, and then become negative as the novelty wears off and the effort feels like a chore, before eventually leveling off.
Now let's examine the plots from the paper's simulated example, which show the model recovering known patterns.
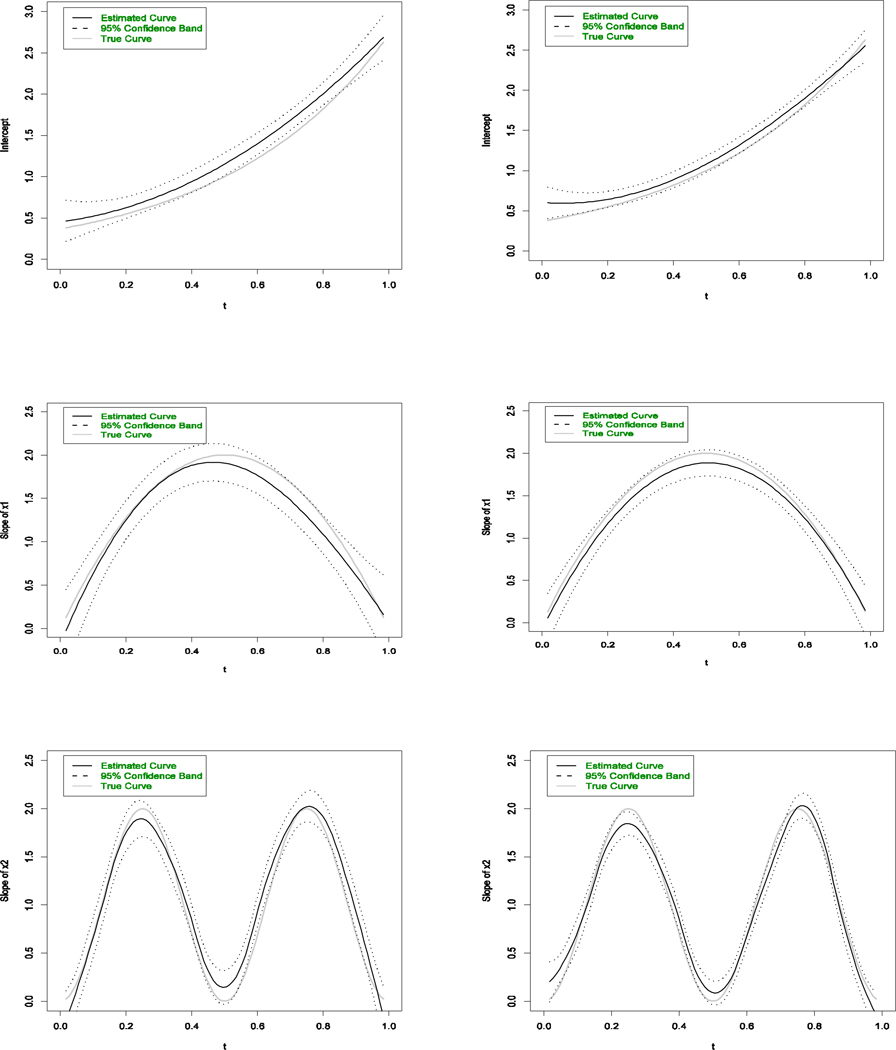
- Middle Row (Slope of x1): This shows a clear quadratic pattern. The effect of
x1on the outcome is initially zero, increases to a peak aroundt=0.5, and then decreases back to zero. This is a pattern of an effect emerging and then habituating. If this were the effect of "wife's disclosure" on "husband's jealousy," it would suggest that disclosure is most impactful mid-way through the process, but its effect diminishes as the husband becomes accustomed to it. - Bottom Row (Slope of x2): This shows a clear sinusoidal or cyclical pattern, similar to the hypothetical one we just discussed. The effect of
x2oscillates between positive and less positive over time. This could represent natural ebbs and flows in emotional influence, perhaps tied to external weekly schedules or internal hormonal cycles.
Case Study: Interpreting Dyadic Dynamics with TV-VAR
The Time-Varying Vector Autoregressive (TV-VAR) model extends these ideas to a multivariate system, making it perfect for dyadic and triadic data. Instead of just one , we can now estimate time-varying autoregressive effects (emotional inertia) and time-varying cross-lagged effects (emotional influence between partners).
Modeling Nonstationary Emotion Dynamics in Dyads using ...
This paper introduces the TV-VAR model and applies it to a couple's daily emotion ratings, providing an excellent example of interpreting changing dyadic influences.
First, review the formal definition of the TV-VAR model. Note how each parameter—the intercepts, autoregressive effects (\beta_{11,t}, \beta_{22,t}), and cross-lagged effects (\beta_{12,t}, \beta_{21,t})—is now a function of time. Now, jump to the empirical example. The core finding is in Figure 10, which plots the coefficient functions for the male's positive affect (PA). Finally, read the discussion of the results. The authors explain how the TV-VAR model revealed a dynamic that the standard, static VAR model missed entirely: the influence of the female's PA on the male's PA only emerged halfway through the study.
Let's break down the interpretation of the results for the male's positive affect (PA) in that paper (Figure 10):
- Intercept (): This function shows the male's expected PA on a given day when his and his partner's PA on the previous day were zero. It shows a slight downward trend, indicating his baseline mood may have been slowly decreasing over the 91 days.
- Autoregressive Effect / Inertia (): This is the effect of the male's own PA on his PA the next day. The authors found this function to be essentially flat and positive. This means he had a stable, moderate level of emotional inertia; his positive mood tended to carry over from one day to the next, and this tendency did not change over the study period.
- Cross-Lagged Effect (): This is the most interesting part. It represents the effect of the female's PA on the male's PA the next day. The plot shows that for the first ~45 days, this effect was zero (the confidence interval includes zero). Her mood had no discernible effect on his. However, around day 45, the effect becomes negative and significant. This is a pattern of emerging influence or sensitization to the partner. After day 45, when her PA was high, his tended to be lower the next day, and vice-versa. A static model would have averaged this out to a small, possibly non-significant effect, completely missing the crucial change in their dynamic.
This is a powerful demonstration of what TVEM/TV-VAR can reveal. For your research, you could generate similar plots to answer questions like:
- Does the effect of the bull's communication style on the wife's guilt habituate over time? (i.e., does the curve for this effect trend towards zero?).
- Does the husband become sensitized to details of the encounters, meaning the effect of disclosure on his jealousy grows stronger over time? (i.e., does the curve trend away from zero?).
- Is there a cyclical pattern to the influence, where the wife's guilt after a date has a strong effect on the husband's jealousy one week, but a weak effect the next?
Conclusion
In this lesson, we have moved from specifying models to interpreting their rich, dynamic output. You now have a framework for translating the shapes of coefficient functions into substantive conclusions about the evolution of emotional responses.
Key Takeaways:
- Time-varying effect patterns like habituation (effect weakens), sensitization (effect strengthens), and cyclical effects (effect oscillates) can be visualized and interpreted using the coefficient function plots from TVEM and TV-VAR models.
- A coefficient function trending towards zero indicates habituation.
- A coefficient function trending away from zero (either more positive or more negative) indicates sensitization.
- An oscillating coefficient function indicates a cyclical or periodic effect.
- Interpreting these plots allows you to tell a much more nuanced story about how relationships evolve, revealing dynamics that static models would average out and obscure.
This ability to analyze how effects change over time is not just an analytical curiosity; it is a critical prerequisite for effective intervention. This brings us to the next module, Designing Experiments for Triadic Interventions. If you know from a TVEM analysis that an intervention's positive effect habituates after ten sessions, you can design your experiment to include a "booster" session at week 11. If you know an effect is cyclical, you can design your measurements to capture both the peaks and the troughs. Your understanding of dynamic effects now enables you to design smarter, more effective experiments.