Hello and welcome to our final practical lesson in the "Basics of the Spring Framework" course.
In our previous session, we explored the health and info endpoints provided by Spring Boot Actuator. You learned how to get a snapshot of your application's health status and expose static build information, which are fundamental for operational visibility. However, to truly understand how your application behaves under load and over time, you need more than a simple "UP" or "DOWN" status. You need quantitative data.
This brings us to our final learning outcome: to use Spring Boot Actuator to expose and interpret application metrics. We will dive into the /actuator/metrics endpoint, which provides a wealth of data about everything from JVM memory usage to HTTP request latency. This is where your system design expertise will be particularly valuable, as we'll connect these metrics to a professional-grade monitoring stack.
By the end of this lesson, you will be able to not only access and understand the metrics your Spring application produces but also integrate it with industry-standard tools for visualization and analysis.
1. The Metrics Endpoint and the Role of Micrometer
Just like the other Actuator endpoints, the metrics endpoint is enabled by adding the spring-boot-starter-actuator dependency. As you learned previously, most endpoints are not exposed over HTTP by default. To start, let's expose the metrics endpoint in your application.properties file:
management.endpoints.web.exposure.include=health,info,metrics
Once you restart your application, you can navigate to /actuator/metrics to see a list of all available metric names.
The following video provides a clear, practical demonstration of enabling the metrics endpoint and exploring the data it provides.
Spring Boot Actuator Full Tutorial
This video by Cameron McKenzie offers a great introduction to the /metrics endpoint. It will walk you through enabling it and accessing various out-of-the-box system and application metrics.
Please watch from 17:37 to 22:19. Focus on: The properties required to enable and expose the metrics endpoint. How to get a list of all available metrics. How to drill down into a specific metric (e.g., system.cpu.count, jvm.memory.used). The types of information you can gather, such as memory usage and garbage collection statistics.
You might be wondering where all this metric-gathering capability comes from. Spring Boot uses a powerful library called Micrometer. Think of Micrometer as the "SLF4J for metrics." Just as SLF4J provides a standard logging API that can be backed by different logging implementations (like Logback or Log4j), Micrometer provides a standard API for collecting metrics that can be exported to dozens of different monitoring systems.
This abstraction is incredibly powerful. You instrument your code once using the Micrometer API, and then you can switch between monitoring backends like Prometheus, Datadog, or New Relic just by changing a dependency and some configuration.
To better understand the core concepts behind Micrometer, the following article explains the different types of "meters" used to measure application behavior.
The Mechanics Behind Spring Boot Actuator Metrics Configuration
This article by Alexander Obregon, titled 'The Mechanics Behind Spring Boot Actuator Metrics Configuration,' provides an excellent conceptual overview of Micrometer's core components. Understanding these is key to knowing what to measure and how.
Read the sections 'How Spring Boot Actuator Metrics Work Internally' and 'The Core of Metric Collection'. Pay close attention to the descriptions of the five main meter types: Counters, Gauges, Timers, Function Meters, and Distribution Summaries. Try to think of a use case for each one.
2. Exploring Built-in Metrics
Spring Boot's auto-configuration automatically registers a wide array of useful metrics for you. Without writing any code, you get deep insights into the JVM, the underlying system, your web server, and more.
The official Spring Boot documentation provides a comprehensive list of all auto-configured instrumentation.
Please review this section of the official Spring Boot documentation to get a full picture of the metrics that are available out-of-the-box.
First, skim the section titled Supported Metrics and Meters. You don't need to memorize it, but get a sense of the breadth of coverage, from JVM and system metrics to more specific ones like Spring MVC, DataSource, and Cache metrics. Next, read the section titled Metrics Endpoint more carefully. This explains how to drill down into a specific meter and, importantly, how to use tags to filter the results. For example, you can query for HTTP requests for a specific URI and status code.
The ability to filter by tags (/actuator/metrics/http.server.requests?tag=uri:/my-endpoint&tag=status:200) is crucial for isolating specific behaviors in your system, which is a common task when troubleshooting or optimizing microservices.
3. Integrating with Prometheus and Grafana
While the /actuator/metrics endpoint is great for quick diagnostics, it's not designed for long-term storage or advanced analysis. For production monitoring, you need to ship these metrics to a dedicated monitoring system. One of the most common stacks for this in the world of microservices is Prometheus for data collection and storage, and Grafana for visualization.
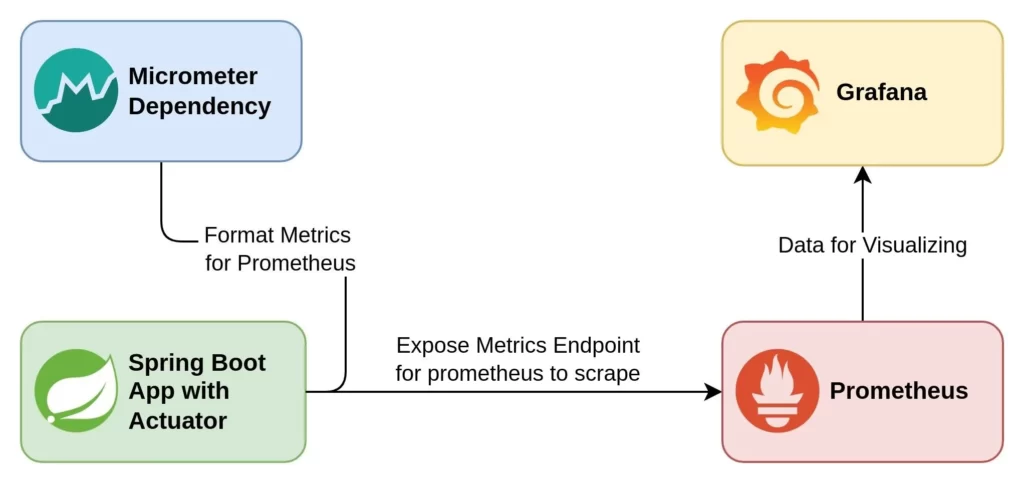
Thanks to Micrometer, configuring our application to expose metrics in a format that Prometheus can understand is straightforward.
-
Add the Prometheus Registry Dependency: Add the following to your
pom.xml. This brings in the necessary adapter that translates Micrometer metrics into the Prometheus exposition format.<dependency> <groupId>io.micrometer</groupId> <artifactId>micrometer-registry-prometheus</artifactId> </dependency> -
Expose the Prometheus Endpoint: Update your
application.propertiesto expose the new/actuator/prometheusendpoint.management.endpoints.web.exposure.include=health,info,metrics,prometheus
After restarting, you can access /actuator/prometheus and you'll see your application's metrics rendered in a text-based format that Prometheus is designed to scrape.
The following video explains this integration and provides the necessary context on how Prometheus works.
Monitoring and Metrics for Spring | with Prometheus - Grafana - Actuator
This video by kanezi demonstrates how to set up the entire monitoring stack. We'll start with the sections on integrating Prometheus.
Please watch from 17:42 to 18:56 and then from 21:44 to 26:09. The first part shows how to add the micrometer-registry-prometheus dependency. The second part provides a concise but thorough explanation of Prometheus's architecture, data model, and query language (PromQL). Given your background, you'll find this architectural overview particularly relevant.
4. Hands-On: Visualizing Metrics in Grafana
Now let's put it all together. The same video provides a docker-compose.yml file to spin up Prometheus and Grafana. By following along, you can build a complete, local monitoring environment to visualize the metrics from your Spring Boot application.
Monitoring and Metrics for Spring | with Prometheus - Grafana - Actuator
This is the practical part of the lesson. You'll see how to use Docker Compose to run the monitoring stack, configure Prometheus to scrape your app, and use Grafana to visualize the data.
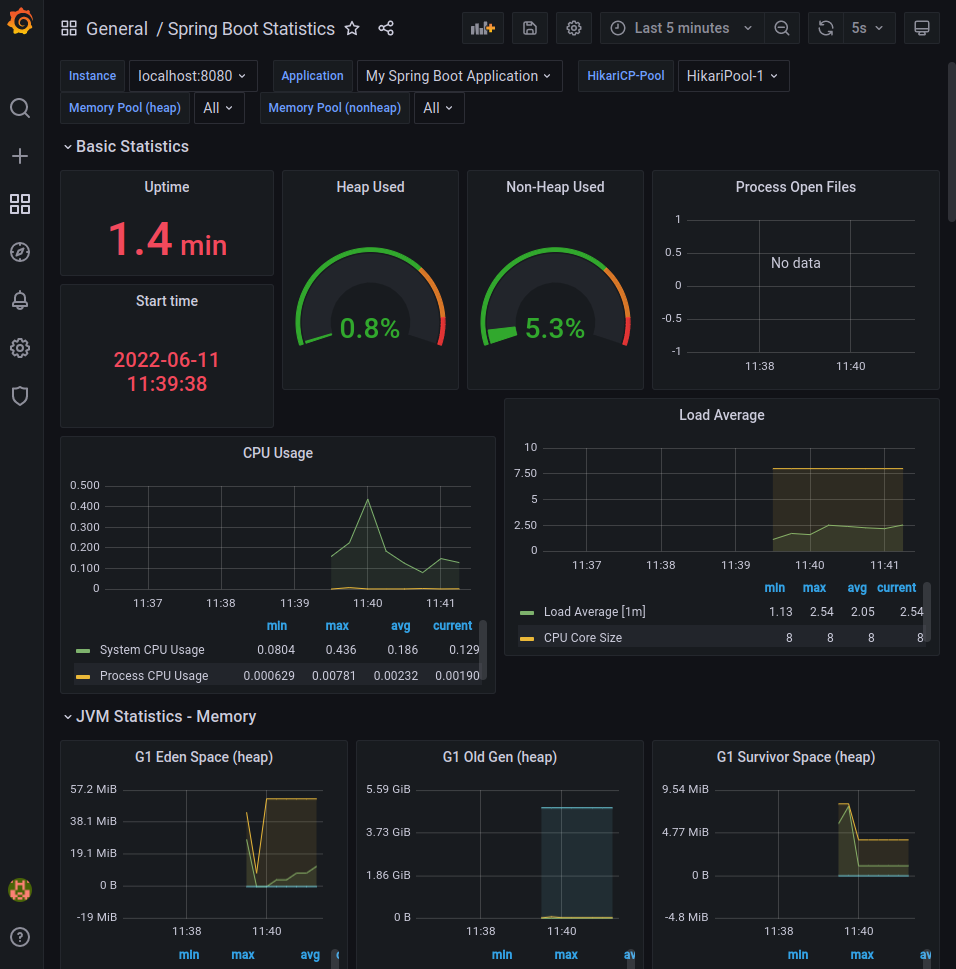
Please watch from 26:09 to 33:34. This segment covers: Using a docker-compose.yml file to start Prometheus and Grafana. Configuring a prometheus.yml file to tell Prometheus where to find your Spring Boot application's /actuator/prometheus endpoint. Connecting Grafana to Prometheus as a data source. Importing a pre-built community dashboard to instantly visualize your JVM and Spring Boot metrics.
Once you've completed this, you'll have a dashboard similar to this, showing live data from your running application.
5. Creating Custom Application Metrics
System-level metrics are essential, but the real power of monitoring comes from creating metrics that are specific to your business domain. For example, you might want to count the number of orders placed, measure the time it takes to process a payment, or track the number of active user sessions.
You can create custom metrics by injecting the MeterRegistry into your Spring beans and using it to create and update meters.
Monitoring and Metrics for Spring | with Prometheus - Grafana - Actuator
This final video clip demonstrates how to create a custom application metric. Here, the presenter times a specific method execution, which is a very common use case.
Watch from 18:56 to 20:55. The video shows how to inject the MeterRegistry and use it to create a Timer to record the execution time of a specific service method. Once created, this custom metric will automatically appear in your /actuator/prometheus endpoint and become available in Grafana.
Here's a simple example of creating a custom counter:
import io.micrometer.core.instrument.Counter;
import io.micrometer.core.instrument.MeterRegistry;
import org.springframework.stereotype.Service;

@Service
public class OrderService {

    private final Counter ordersPlacedCounter;

    public OrderService(MeterRegistry meterRegistry) {
        // Create a counter. The name, description, and tags are used
        // to identify the metric in the monitoring system.
        this.ordersPlacedCounter = Counter.builder("orders.placed")
                .description("The number of orders placed.")
                .tag("region", "us-east") // Example tag
                .register(meterRegistry);
    }

    public void placeOrder() {
        // Business logic for placing an order...

        // Increment the counter each time an order is placed.
        this.ordersPlacedCounter.increment();
    }
}
This simple pattern allows you to instrument any part of your application and gain quantitative insights into its business-level operations.
Conclusion
Congratulations on completing the final lesson! You have now journeyed from the fundamentals of Java for Spring, through dependency injection and REST APIs, all the way to containerizing and monitoring your application.
Key Takeaways from this Lesson:
- Spring Boot Actuator uses Micrometer as a facade to provide a rich set of application metrics.
- The
/actuator/metricsendpoint allows for diagnostic inspection, while the/actuator/prometheusendpoint exposes data for external monitoring systems. - A vast array of built-in metrics for the JVM, system, web server, and more are available with zero configuration.
- For production use, you should integrate with a time-series database like Prometheus and a visualization tool like Grafana.
- You can create custom, business-specific metrics by injecting the
MeterRegistryand creatingCounters,Timers, orGauges.
You have successfully covered all the learning outcomes for this course. With the knowledge you've gained, you now have a solid foundation to build, package, and operate robust microservices and web applications using the Spring ecosystem. Well done