Hello! Welcome to the third lesson in our course on Deep Learning for Time Series Forecasting.
In our last lesson, you learned the essential mechanics of loading, parsing, and manipulating time series data using pandas. We covered how to create a DatetimeIndex, resample data to different frequencies, and create lag features with .shift(). These skills gave us a dataset that is correctly structured for analysis.
Today, we take the next logical step: visualizing that data. This lesson is all about Exploratory Data Analysis (EDA) through visualization. We'll learn how to translate raw numbers into insightful charts that reveal the underlying structure of our data. Your goal is to visualize time series data to identify its patterns (like trend and seasonality), anomalies, and other important features. This is one of the most critical and revealing steps in any forecasting project.
We will be using popular Python libraries like Matplotlib, Seaborn, and Plotly to create our visualizations.
1. The Foundational Line Plot: Your First Look at the Data
The first and most important visualization for any time series is a simple line plot of the value against time. This single chart provides a high-level overview and can immediately reveal dominant characteristics like long-term trends, repeating seasonal patterns, and obvious outliers.
Analyze Time-Series Data with Python: A Complete Guide
To start, let's read a quick summary from the article 'Analyze Time-Series Data with Python' which reinforces why the line graph is our primary tool.
Read the sections 'How to visualize your time series data effectively' and 'The basics of plotting time series data'. These short paragraphs perfectly set the stage for why we start with a line plot.
Now, let's see this in practice. While Matplotlib is excellent for static plots, modern interactive libraries like Plotly can make exploration much more dynamic. The following video uses Plotly Express, a high-level wrapper that makes creating beautiful, interactive plots very straightforward.
Exploratory Data Analysis (EDA) with Plotly for Timeseries Demand Forecasting
Watch this segment from Jeff Heaton's tutorial. It shows how to generate a line chart of total sales over time using Plotly Express. Notice how it instantly reveals both a yearly seasonal pattern and an upward trend.
Watch from 04:27 to 06:41. Pay attention to how the code groups the data by date before plotting and how the interactivity of the plot allows you to zoom in to see finer details.
As you saw, a simple call to px.line() after grouping the data gives you a powerful, interactive view. This is your starting point for forming hypotheses about the data. Do you see a trend? Is there a repeating pattern? Are there any strange spikes or drops?
2. Visualizing Specific Patterns and Distributions
Once the overall line plot gives you some clues, the next step is to zoom in and confirm those patterns. We often want to investigate seasonality at different frequencies (e.g., weekly, monthly, yearly).
Bar Charts for Cyclical Timeframes
If you suspect a weekly pattern (e.g., sales are higher on weekends), you can't easily see that in a plot spanning several years. A better approach is to group the data by the day of the week and plot the average or total values using a bar chart.
The next clip from Jeff Heaton's video demonstrates this perfectly.
Exploratory Data Analysis (EDA) with Plotly for Timeseries Demand Forecasting
This clip shows how to create a bar chart to confirm weekly seasonality. A key takeaway here is the importance of ordering your categorical data correctly for a meaningful plot.
Watch from 06:41 to 08:12. Note the use of category_orders in Plotly to ensure the days of the week are plotted in their natural order (Monday, Tuesday, etc.) rather than alphabetically or by value.
Box Plots for Deeper Distributional Insights
While a bar chart shows an aggregate value (like the mean or sum), a box plot gives you a much richer view of the distribution of values for each period. It shows the median, interquartile range (IQR), and potential outliers, all in one compact visualization. This is excellent for comparing distributions and spotting anomalies.
The following video explores a dataset of energy consumption and uses box plots to analyze monthly patterns.
Exploratory Data Analysis For Time Series: Machine Learning Project Energy Consumption Data
In this segment from Giraffa Analytics, you'll see how to use box plots to compare energy consumption across different months. This is a powerful way to visualize both seasonality and identify outliers.
Watch from 00:53:50 to 00:56:54. Observe how the box plots clearly show that winter months have higher average consumption and also highlight individual data points that are outliers for their respective months.
3. Smoothing to Clarify Trends
Time series data is often "noisy," meaning it has random, short-term fluctuations. This noise can make it difficult to see the underlying trend. A common technique to address this is to calculate a moving average (also called a rolling average). This smooths out the noise by averaging data points over a specified time window.
Your pandas skills are directly applicable here, using the .rolling() method.
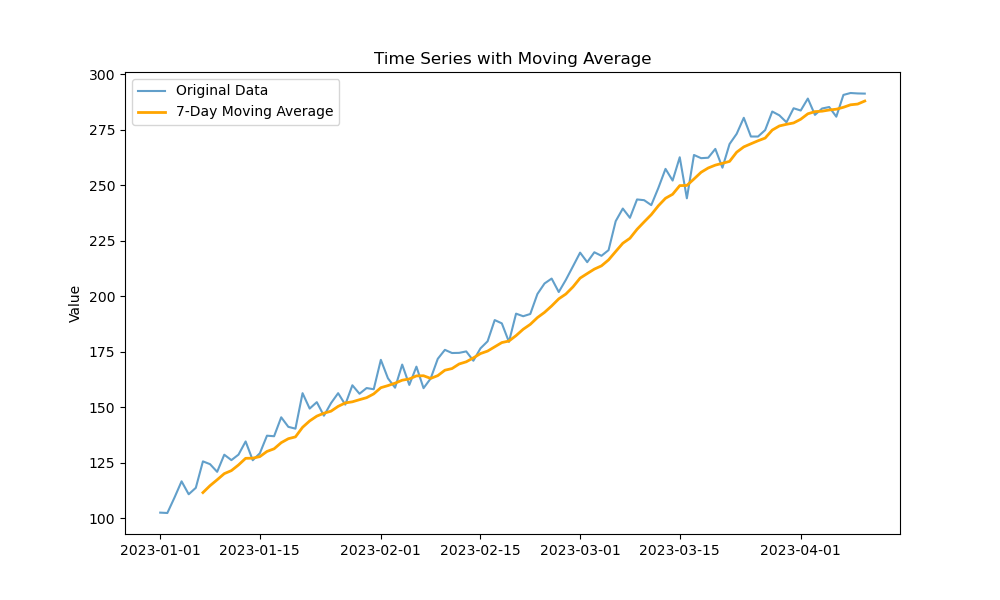
Here is a typical code snippet to generate such a plot, assuming your data is in a pandas Series ts_data:
import matplotlib.pyplot as plt

# Calculate the 7-day moving average
moving_avg = ts_data.rolling(window=7).mean()

# Plot the original data and the moving average
plt.figure(figsize=(12, 6))
plt.plot(ts_data, label='Original Data')
plt.plot(moving_avg, label='7-Day Moving Average', color='orange')
plt.title('Time Series with Moving Average')
plt.legend()
plt.show()
Test your understanding!
You are analyzing daily website traffic data. The raw line plot is very spiky and hard to read. You want to see the general weekly and monthly trends more clearly. What window sizes might you choose for the .rolling() method to achieve this?
Show answer
To see the weekly trend, a window size of 7 would be appropriate, as it would average out the daily fluctuations within each week. To see the general monthly trend, you might choose a window size of around 30. The larger the window, the smoother the resulting curve will be.
4. Visualizing Data Quality and Anomalies
Visualization isn't just for finding modeling patterns; it's also a powerful diagnostic tool for identifying data quality issues.
A particularly useful technique for multivariate datasets (like sensor data) is to visualize when data points are missing. Spikes, dips, or flat lines in the main time series plot can indicate anomalies, but plotting the absence of data can be just as revealing.
Exploratory Data Analysis For Time Series: Machine Learning Project Energy Consumption Data
This practical example from Giraffa Analytics demonstrates how to calculate and plot the percentage of missing values over time. This can help you spot periods where many sensors or devices were offline, a critical piece of information for any subsequent analysis.
Watch from 21:51 to 25:10. The key idea is to sum the boolean is.na() result across rows (axis=1) to count missing values at each timestamp and then plot this new time series.
5. Visualizing Multiple Time Series
When working with multivariate data, you need ways to understand the relationships between the different series.
Correlation Heatmaps
A correlation matrix heatmap is a fantastic tool for getting a quick overview of the linear relationships between all pairs of time series in your dataset. It helps you answer questions like: "Do series A and B tend to move together?" or "Do they move in opposite directions?"
Exploratory Data Analysis For Time Series: Machine Learning Project Energy Consumption Data
Let's return to the Giraffa Analytics video to see how to compute a Pearson correlation matrix and visualize it as a heatmap using Seaborn.
Watch from 25:10 to 32:00. Focus on how the heatmap provides a bird's-eye view of all correlations. The bright squares on the diagonal are the series correlated with themselves (always 1). The off-diagonal bright or dark squares indicate strong positive or negative correlations worth investigating further.
Overlaying and Faceting Plots
After a heatmap identifies interesting pairs, you can plot them together on a line chart to visually confirm their relationship.
For comparing more than a handful of series, overlaying them on a single plot can become a "spaghetti plot" — tangled and unreadable. A cleaner approach is to use "small multiples" or faceted charts, where each time series gets its own small graph, but they all share the same time axis. This makes side-by-side comparison much easier.
Analyze Time-Series Data with Python: A Complete Guide
This article provides a concise explanation of strategies for comparing multiple series, including the concept of faceted charts.
Read the short section 'How to plot and compare multiple series' to understand the motivation behind using small multiples.
Conclusion
You've now learned the fundamental techniques for visualizing time series data. This is an exploratory and iterative process. A good visualization can confirm a hypothesis, reveal an unexpected pattern, or flag a data quality issue that needs to be addressed before modeling.
Key Takeaways:
- Start with a Line Plot: It's your primary tool for seeing the overall trend, seasonality, and obvious anomalies.
- Use Bar and Box Plots for Seasonality: Aggregate your data by a time period (day of week, month) to create bar charts (for totals/means) or box plots (for distributions) to confirm seasonal patterns.
- Smooth with Moving Averages: Use
rolling().mean()to smooth out noise and clarify the underlying trend. - Visualize Data Quality: Plotting missing values or other data quality metrics over time is a critical diagnostic step.
- Analyze Multiple Series: Use correlation heatmaps for a high-level overview and faceted plots for clear side-by-side comparisons.
In our next lesson, we will move from visual exploration to statistical analysis. We will learn how to formally decompose a time series into its trend, seasonal, and residual components, putting a mathematical structure on the patterns we've learned to identify by eye today.