Hello! Let's dive into the next stage of your system administration training.
In our last lesson, we mastered dmesg, our tool for understanding a broken system by looking at kernel-level hardware messages. Today, we shift from diagnosing outright failures to tackling a more subtle and common problem: a server that isn't broken, but is just frustratingly slow. You'll frequently encounter tickets where the complaint is simply "the application feels sluggish," and it will be your job to find out why.
This lesson directly addresses that challenge. You will learn how to identify the resource bottleneck (CPU, memory, or I/O) on a slow server using vmstat, iostat, and iotop. We will follow a systematic process that starts with a broad overview and drills down to the specific cause—a crucial skill for both day-to-day operations and for explaining your thought process in a job interview.
1. The "Idle but Slow" Mystery
A common head-scratcher for new administrators is when a server is slow, but a quick look at top or htop shows very low CPU usage. If the CPU isn't busy, what's causing the delay? The answer is often that the CPU is waiting for something else. This "something else" is usually the I/O (Input/Output) subsystem—disks and network.
Let's begin by understanding the common culprits behind this scenario.
Why Your Linux Server “Looks Idle” but “Feels” Slow
This article, "Why Your Linux Server “Looks Idle” but “Feels” Slow", perfectly introduces the core problem we're solving today. It outlines the main reasons a server can feel slow even when CPU usage is low.
Please read the introduction and the section "Understanding the Idle-but-Slow Scenario". Focus on grasping the key concepts of: Disk I/O Wait: What it means when the CPU is waiting for disk operations. Memory Pressure and Swapping: How using the disk as slow memory can grind a system to a halt. Network Delays: How waiting on external resources can make a server seem idle.
As you've just read, low CPU usage doesn't mean the system is healthy. It often means the bottleneck lies elsewhere. Our job is to find it.
2. A Systematic Approach to Bottleneck Analysis
When troubleshooting performance, it's essential to follow a logical path from a high-level view to a specific cause. Our workflow will be:
- Get a broad system snapshot: Is the bottleneck CPU, memory, or I/O?
- Drill down into the suspected subsystem: If it's I/O, how busy is the disk?
- Pinpoint the offending process: Which specific application is causing the high I/O?
We'll use a suite of powerful command-line tools for this, starting with vmstat.
3. vmstat: The System-Wide Snapshot
vmstat (Virtual Memory Statistics) is our first tool. It gives a fantastic, one-line summary of what the system is doing right now, covering processes, memory, swap, I/O, and CPU activity. It's the perfect starting point to form a hypothesis.
Let's see it in action.
Linux Performance Troubleshooting Demos
This video, "Linux Performance Troubleshooting Demos," provides a great practical demonstration. We'll start with a scenario where an application is slow due to a disk bottleneck.
Watch the first demo from 00:00 to 03:00. Pay close attention to the vmstat output and how the presenter interprets these key columns: r (runnable): Processes waiting for CPU time. si/so (swap-in/swap-out): Shows if the system is using disk for memory. us/sy/id (user/system/idle): The breakdown of CPU time. wa (wait I/O): The most important column for our scenario. This is the percentage of time the CPU was idle but waiting for an I/O operation to complete.
The key takeaway from the video is the importance of the wa column. If you see a consistently high value here (e.g., >20%), you have strong evidence that your bottleneck is I/O-related. The CPUs are ready to work, but they are stuck waiting for data from the disk.
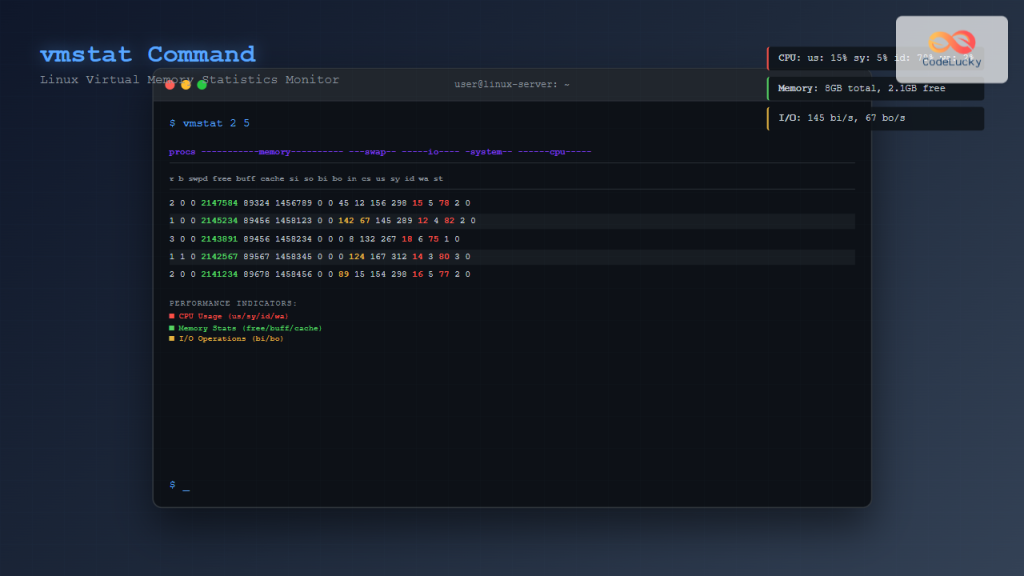
Your Turn: Interpreting vmstat
Run this command in your terminal: vmstat 1 10
This will print a new line of statistics every second for 10 seconds.
- If
wais high: Your system is I/O bound. Proceed to the next step. - If
siorsoare non-zero: Your system is under memory pressure and is swapping. This is a memory bottleneck. - If
ris consistently higher than your number of CPU cores andidis near zero: Your system is CPU bound.
4. iostat: Confirming the Disk Bottleneck
Let's assume vmstat showed a high I/O wait. Our hypothesis is a disk bottleneck. Now, we need to confirm it with iostat (Input/Output Statistics), which provides detailed, per-device metrics.
The video you just watched continues to demonstrate iostat.
Linux Performance Troubleshooting Demos
Let's continue with the same demo to see how iostat is used to confirm the disk bottleneck.
Rewatch the section from 03:00 to 04:00. This time, focus on the iostat output. The presenter highlights the most critical metric: %util.
The %util column shows the percentage of time the disk device was busy processing requests.
- A value consistently over 60% indicates the disk is getting busy and performance may start to degrade.
- A value approaching 100% means the disk is saturated. It cannot handle any more requests, and this is almost certainly your performance bottleneck.
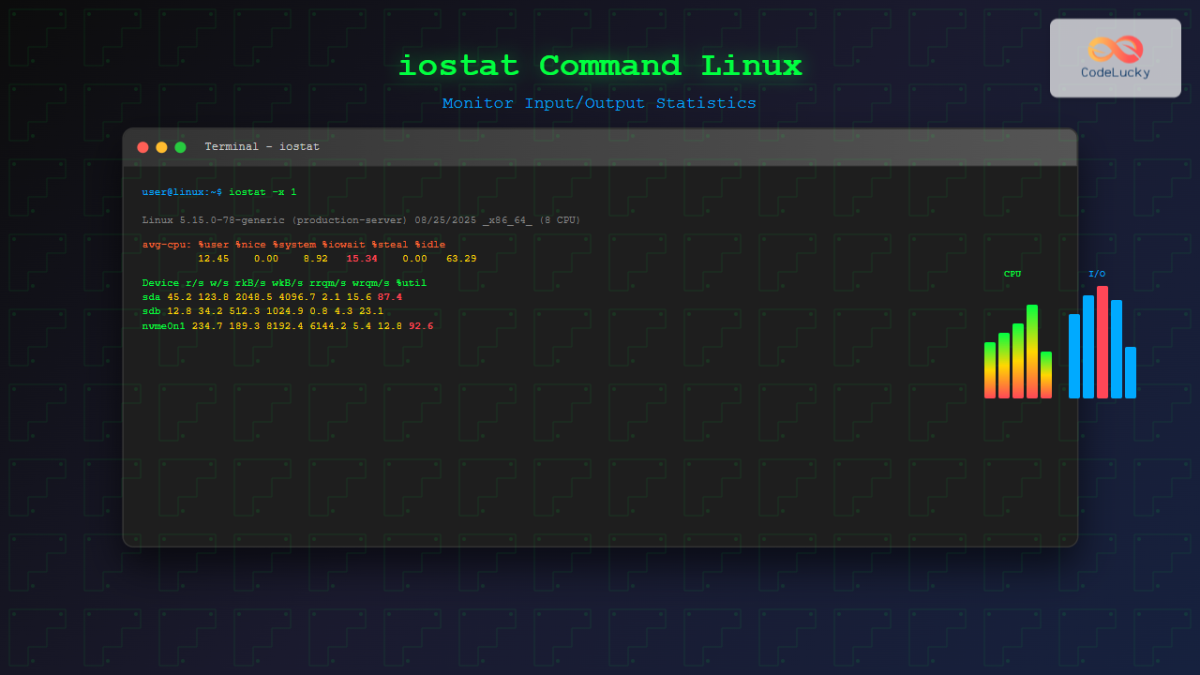
Your Turn: Running iostat
To use iostat, you may first need to install the sysstat package:
# For Ubuntu/Debian
sudo apt update && sudo apt install sysstat


# For RHEL/CentOS/Fedora
sudo dnf install sysstat
Now, run this command: iostat -xz 1 10
The -x provides extended statistics, -z hides devices with no activity, and 1 10 samples every second for 10 seconds. Check the %util for your main disk (e.g., sda or nvme0n1).
5. iotop: Finding the I/O Hog
So far, we've confirmed the system is slow because of an I/O wait, and that a specific disk is saturated. The final question is: which process is causing all this disk activity? For that, we use iotop.
Why Your Linux Server “Looks Idle” but “Feels” Slow
The article we looked at earlier has an excellent section on iotop, explaining how it works and providing practical examples.
Please read the section "Using iotop to Trace I/O Hogs". Pay attention to: How iotop provides a top-like interface for I/O. The meaning of the DISK READ and DISK WRITE columns. The usefulness of the -o flag to only show processes actively doing I/O.
Your Turn: Finding the Culprit
You may need to install iotop:
# For Ubuntu/Debian
sudo apt install iotop


# For RHEL/CentOS/Fedora
sudo dnf install iotop
Now, run it with sudo iotop -o. The -o flag is great because it filters out noise, only showing you processes that are currently reading from or writing to the disk. The process at the top of the list is your "I/O hog"—the one responsible for the bottleneck. This could be a database like mysqld, a backup script, a logging service, or a web server.
6. Summary: Your Troubleshooting Workflow
You now have a powerful and repeatable workflow for diagnosing a slow server.
| Step | Question | Command | What to Look For |
|---|---|---|---|
| 1 | What kind of bottleneck is it? | vmstat 1 |
High wa (I/O), si/so (Memory), or r with low id (CPU). |
| 2 | Is the disk saturated? | iostat -xz 1 |
High %util (e.g., >80%) on a specific device. |
| 3 | Which process is responsible? | sudo iotop -o |
The process at the top of the list with high DISK READ/WRITE. |
This article provides a great cheat sheet that summarizes which tool to use for which problem.
How to Monitor Linux System Performance...
This article, "How to Monitor Linux System Performance...", contains a fantastic summary table and a step-by-step example that reinforces our workflow.
Review the sections "When to Use Which Tool (Quick Summary)" and "Real Troubleshooting Example". This neatly packages everything we've just learned.
Conclusion
Fantastic work. You've moved beyond just fixing what's broken and are now learning to analyze and tune system performance. This is a fundamental skill that separates a junior from a senior administrator. You now have a clear, evidence-based method to respond to the vague "server is slow" complaint.
Key Takeaways:
- A server can feel slow even with low CPU usage if it's I/O bound—meaning the CPU is waiting for the disk.
- Use a systematic workflow:
vmstatfor a broad overview,iostatto confirm disk saturation, andiotopto identify the specific process. - Key metrics to remember:
vmstat:wa(I/O wait),si/so(swap in/out).iostat:%util(disk utilization).iotop: The process with the highestDISK READ/WRITE.
In this lesson, we diagnosed issues with how our disks are being used. What if the problem isn't just usage, but that we're running out of space or need more flexible disk management? In our next lesson, we will address this by learning how to create, extend, and resize logical volumes using LVM to manage disk storage dynamically.