Hello! Welcome to a new module in our course. We've just wrapped up our exploration of methods for paired and repeated categorical data, culminating in Conditional Logistic Regression for analyzing binary outcomes in matched studies.
Now, we're shifting our focus to a different type of response variable: count data. Instead of modeling a "yes/no" or "case/control" outcome, we'll be modeling variables that represent "how many"—for example, the number of emails received per hour, the number of patients arriving at an ER per day, or the number of defects in a product batch.
This lesson introduces the foundational model for this type of analysis. Our goal is to formulate a Poisson regression model for count data and explain the interpretation of the log link function. By the end of this lesson, you'll understand why standard linear regression isn't suitable for counts and how Poisson regression, as a type of Generalized Linear Model (GLM), provides a powerful alternative.
1. Why is Count Data Different?
Before we introduce a new model, it's important to understand why our existing tools, like ordinary linear regression, are often inappropriate for count data.
Count data has several distinct characteristics:
- Non-negative integers: Counts can only be 0, 1, 2, ... and never negative or fractional.
- Skewed distribution: The data is often right-skewed, with most observations having low counts and a few having very high counts.
- Variance related to the mean: Unlike the assumption of constant variance (homoscedasticity) in linear regression, with count data, the variance tends to increase as the mean count increases.
Applying a simple linear model to count data can lead to several problems, including nonsensical predictions.
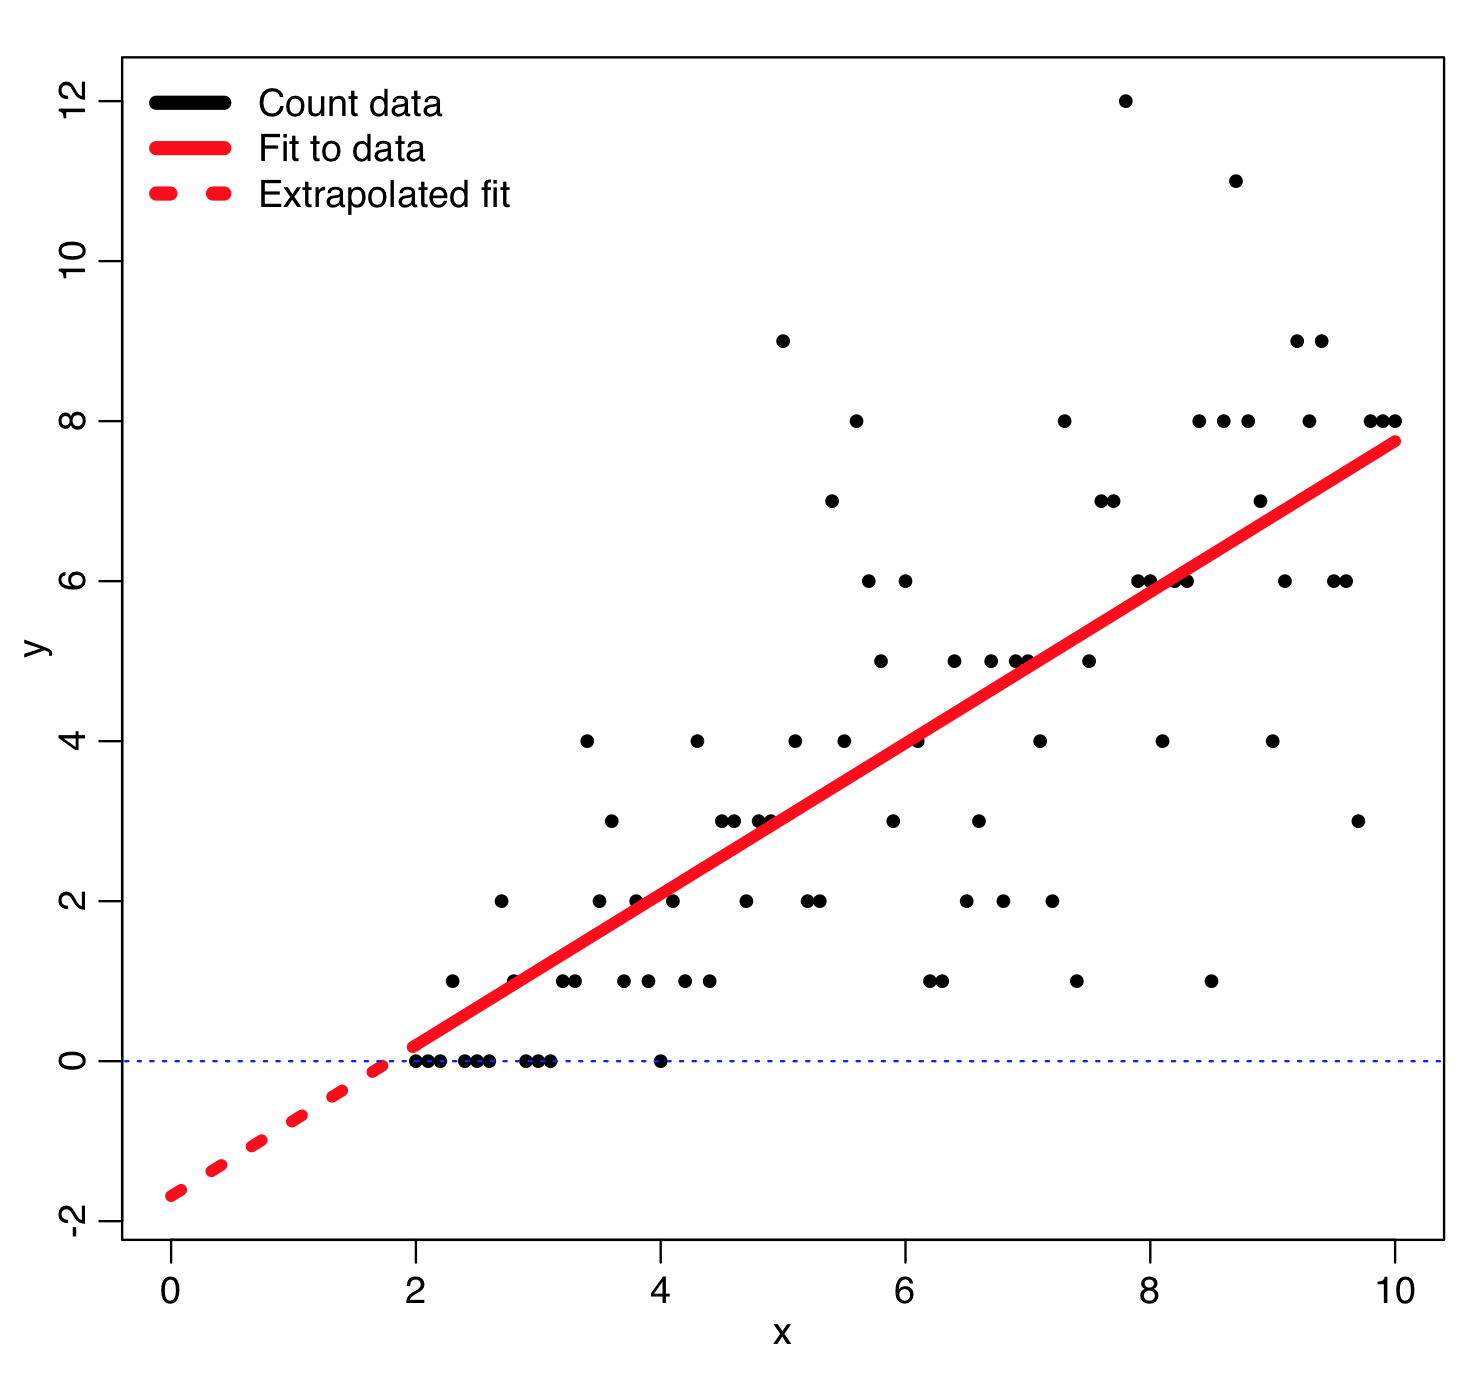
The following video provides a clear, quick summary of these issues.
Poisson regression - clearly explained
Watch this first part of the video from TileStats to see a visual example of why linear regression fails for count data and how an exponential model is a better starting point.
Please watch from 00:23 to 01:59. Focus on the two main problems identified when fitting a straight line to the rabbit birth data.
To address these issues, we need a model that is specifically designed for the properties of count data. This brings us to Poisson regression.
2. The Poisson Regression Model: A GLM Approach
As you'll recall from our discussions on logistic regression, a Generalized Linear Model (GLM) provides a flexible framework for modeling different types of response variables. Poisson regression is a GLM tailored for count data.
To understand its structure, let's review the three core components of any GLM. The following reading provides a great refresher and applies it directly to count data models.
Chapter 20 Generalized linear models I: Count data
This text clearly defines the three parts of a GLM and contrasts the GLM approach with the simple linear model framework. It's essential for understanding how Poisson regression is constructed.
Please read the introduction and Section 20.1, 'The generalized linear model'. Pay close attention to the definitions of the stochastic part, the systematic part, and the link function.
As you just read, the three components for a Poisson regression model are:
-
Random/Stochastic Component: The response variable (the count) is assumed to follow a Poisson distribution. A key property of the Poisson distribution is that its mean and variance are equal. We denote the mean (and variance) as .
This directly addresses the issue that variance often increases with the mean in count data.
-
Systematic Component: This is the linear predictor, which is a linear combination of the explanatory variables (). It has the same form as in linear regression.
-
Link Function: This function, , connects the mean of the response, , to the linear predictor, . For Poisson regression, the standard and canonical link function is the natural logarithm (log) link.
3. Formulating the Model and the Role of the Log Link
Putting these three components together, we get the formal Poisson regression model:
This equation states that the log of the mean count is a linear function of the predictors. This is the "formulation" of the model. Now, let's explore why this log link is so important.
What does the log link do?
-
Ensures Positive Predictions: By modeling the log of the mean, we ensure that the predicted mean count itself is always positive. If we rearrange the equation, we get:
Since the exponential function always returns a positive value, our model's predicted mean count, , can never be negative. This elegantly solves one of the major problems of using linear regression.
-
Linearizes the Relationship: The log link transforms a non-linear, multiplicative relationship on the original "response scale" into a linear, additive relationship on the "link scale."
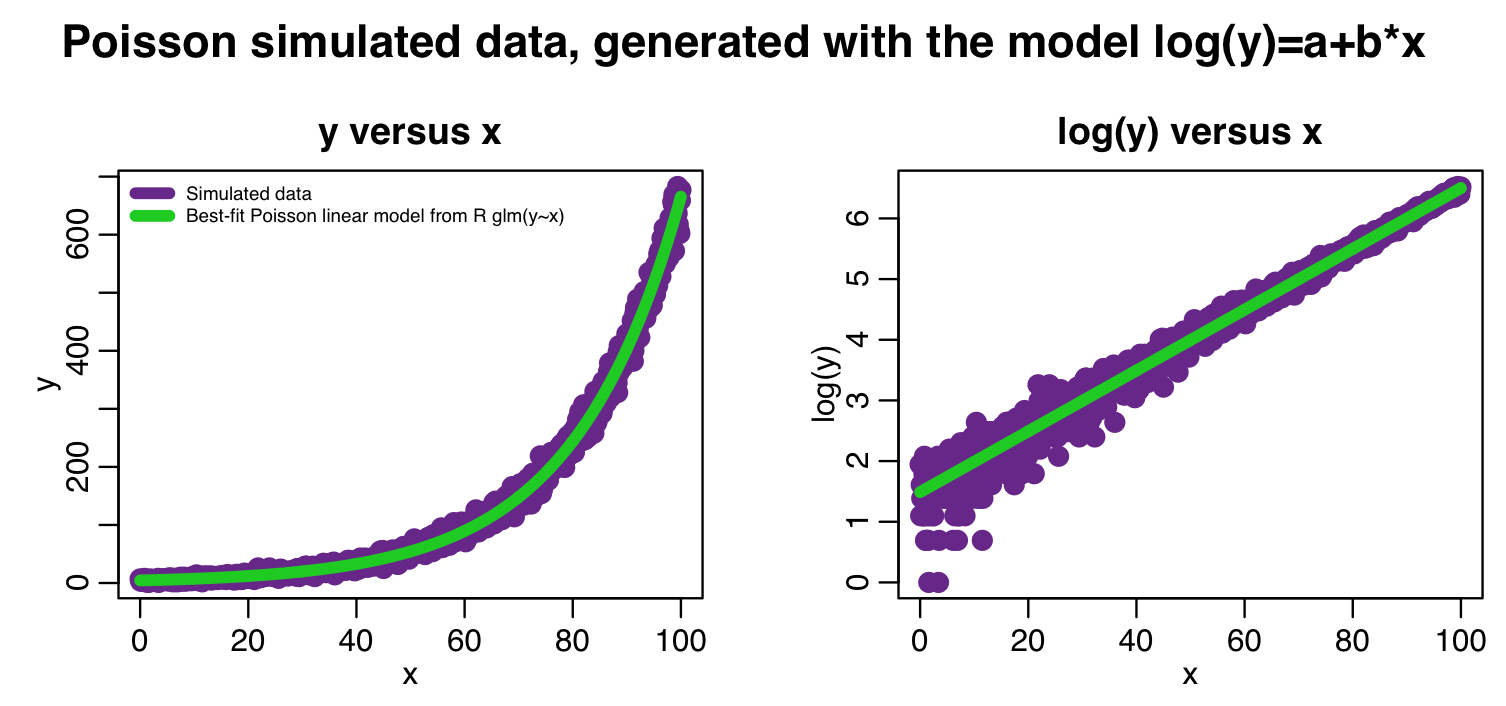
The following reading provides a concise summary of the Poisson regression model, its assumptions, and reinforces the role of the log link.
Chapter 4 Poisson Regression | Beyond Multiple Linear ... - Bookdown
This chapter from the book 'Beyond Multiple Linear Regression' gives a formal introduction to Poisson regression and its assumptions.
Please read Section 4.2, 'Introduction to Poisson Regression'. Focus on the model equation and the list of four assumptions. This will solidify the formal structure of the model.
4. Interpreting Coefficients with a Log Link
Understanding the log link is critical for correctly interpreting the model's coefficients ().
In a linear model, is the change in the mean response for a one-unit change in . In Poisson regression, is the change in the log of the mean response for a one-unit change in . This "log-scale" interpretation isn't very intuitive.
To get a more practical interpretation, we need to back-transform from the log scale. Let's see how this works for a simple model with one predictor, :
- For a value of , the log-mean is:
- For a value of , the log-mean is:
Subtracting the first equation from the second gives us:
Using the properties of logarithms (), we get:
Finally, by exponentiating both sides, we isolate the ratio of the means:
This quantity, , is called the Rate Ratio (RR) or Incidence Rate Ratio (IRR).
This leads to our key interpretation:
For a one-unit increase in , the mean count is multiplied by a factor of .
For example, if , then . This means a one-unit increase in is associated with a 22% increase in the mean count. If , then , meaning a one-unit increase in is associated with a 10% decrease in the mean count.
The following resources walk through this interpretation with clear examples.
Poisson regression - clearly explained
This part of the TileStats video explicitly covers the GLM components and then moves into how to interpret the coefficients. It provides a great verbal and visual explanation.
Please watch from 06:29 to 11:44. The first part (until 08:30) reinforces the GLM structure. The second part demonstrates exactly how to interpret the coefficients on both the log scale and the more intuitive original scale.
Chapter 4 Poisson Regression | Beyond Multiple Linear ... - Bookdown
This text provides the same interpretation in a written format, deriving the rate ratio just as we did above. This is an excellent reference to solidify the concept.
Please read the first part of Section 4.4.3, 'Estimation and Inference'. Focus on the derivation in Equation (4.1) and the explanation of how to interpret the exponentiated coefficient as a rate ratio.
Conclusion
In this lesson, we have laid the groundwork for analyzing count data. We established why linear regression is unsuitable and how Poisson regression provides a robust, theoretically sound alternative within the GLM framework.
Key Takeaways:
- Count data is non-negative, integer-valued, and often exhibits a mean-variance relationship that violates the assumptions of linear regression.
- Poisson regression is a GLM that assumes a Poisson distribution for the response variable (the random component).
- It uses a log link function to connect the mean of the count () to a linear predictor ().
- The model is formulated as: .
- The log link serves two critical purposes: it ensures all predicted mean counts are positive and it linearizes the model's structure.
- A coefficient is interpreted by exponentiating it: is the Rate Ratio, representing the multiplicative change in the mean count for a one-unit increase in the predictor .
Preview of the Next Lesson:
Now that you understand the structure of the model and the principle behind interpreting its coefficients, we will move on to a more hands-on application. In the next lesson, we will focus on fitting a Poisson regression model to data and practicing the conversion of coefficients into interpretable rate ratios with confidence intervals.