Hello! Welcome to the next lesson in our journey through Spark SQL transformations.
In our previous lesson, we mastered CAST and TRY_CAST to transform data within columns, ensuring each field has the correct data type. Today, we're taking a bigger step: we'll learn how to transform the very structure of our tables.
This lesson covers PIVOT and UNPIVOT, two powerful operations for reshaping data. You will learn how to use PIVOT to rotate rows into columns to create summarized, "wide" tables, and UNPIVOT to do the reverse, converting columns back into rows for a "long" format. Mastering this is crucial for creating reports, preparing data for machine learning models, and normalizing messy datasets.
Introduction: Wide vs. Long Data Formats
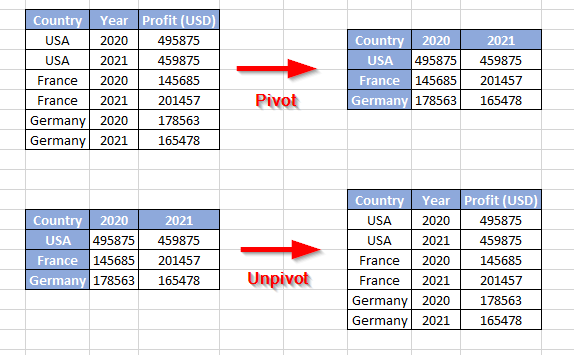
Data can often be structured in two primary ways: long format or wide format.
- Long Format: Each row is a single observation. It's great for storing data but can be hard to read for summary purposes. (e.g., a row for each product sale, per month).
- Wide Format: Each row contains several observations for a single subject. It's often more human-readable and is the format expected by many reporting tools. (e.g., a row for each product, with columns for each month's sales).
PIVOT and UNPIVOT are the tools you use to switch between these formats.
1. The PIVOT Operation: From Rows to Columns
The PIVOT clause rotates a table by turning unique values from one column into new, separate columns. In this process, it performs an aggregation on another column. This is best understood through its syntax and an example.
Let's start by reading the official Databricks blog post, which provides an excellent explanation of PIVOT in Spark SQL.
SQL Pivot: Converting Rows to Columns | Databricks Blog
This Databricks blog post, "SQL Pivot: Converting Rows to Columns", clearly explains the PIVOT feature with a practical example using temperature data.
Please read the sections titled "Examining Summer Temperatures with Pivot" and "Pivoting in SQL". Focus on: The structure of the PIVOT query. The role of the aggregate function (avg(temp) in their example). The FOR clause, which identifies the pivot column (the column whose values become new column headers). The IN clause, which lists the specific values you want to turn into columns. The concept of implicit group-by columns.
Deconstructing the PIVOT Syntax
As you saw in the blog post, the PIVOT clause has a few key components:
- Source Data: A subquery in the
FROMclause that selects the columns you'll need. - Aggregate Function: A mandatory function like
SUM(),AVG(),COUNT(), etc. This tells Spark what value to put in the cells of the new pivoted table. - Pivot Column: Specified in the
FORclause. The unique values in this column will become the headers of your new columns. - Pivot Values: Specified in the
INclause. This is an explicit list of the values from the pivot column that you want to transform into columns.
Let's look at the structure from the blog post again, but simplified:
SELECT * FROM (
  -- 1. Source Data: The columns we care about
  SELECT year, month, temp FROM temperatures
)
PIVOT (
  -- 2. Aggregate Function: what to calculate for each new cell
  AVG(temp)
  -- 3. Pivot Column: which column's values become the new column names
  FOR month
  -- 4. Pivot Values: which specific values to use as new columns
  IN ('JAN', 'FEB', 'MAR', ...)
);
The "implicit group-by" is a critical concept. Any column selected in the source query that is not the pivot column and is not in the aggregate function becomes a grouping key. In the example above, year is the implicit group-by column. The result is one row for each year.
2. Hands-On Practice with PIVOT
Let's solidify this with a hands-on exercise. Open a Databricks notebook and run the following queries.
Step 1: Create Sample Data
Let's create a table of quarterly sales data in a "long" format.
CREATE OR REPLACE TEMPORARY VIEW sales_data AS
SELECT 'Desktop' AS product, 'Q1' AS quarter, 15000 AS amount
UNION ALL
SELECT 'Desktop' AS product, 'Q2' AS quarter, 22000 AS amount
UNION ALL
SELECT 'Desktop' AS product, 'Q3' AS quarter, 18000 AS amount
UNION ALL
SELECT 'Desktop' AS product, 'Q4' AS quarter, 25000 AS amount
UNION ALL
SELECT 'Laptop' AS product, 'Q1' AS quarter, 32000 AS amount
UNION ALL
SELECT 'Laptop' AS product, 'Q2' AS quarter, 35000 AS amount
UNION ALL
SELECT 'Laptop' AS product, 'Q3' AS quarter, 30000 AS amount
UNION ALL
SELECT 'Laptop' AS product, 'Q4' AS quarter, 41000 AS amount;

-- View the raw data
SELECT * FROM sales_data;
You'll see a table with three columns: product, quarter, and amount.
Step 2: Pivot the Data
Now, write a query to transform this table so that each product has one row, and the quarters (Q1, Q2, etc.) are columns.
SELECT * FROM sales_data
PIVOT (
  SUM(amount) AS total_sales
  FOR quarter IN ('Q1', 'Q2', 'Q3', 'Q4')
);
Result:
| product | Q1_total_sales | Q2_total_sales | Q3_total_sales | Q4_total_sales |
|---|---|---|---|---|
| Desktop | 15000 | 22000 | 18000 | 25000 |
| Laptop | 32000 | 35000 | 30000 | 41000 |
Notice how product became the implicit GROUP BY column, and the values from the quarter column are now the new column headers.
3. The UNPIVOT Operation: From Columns to Rows
UNPIVOT is the logical inverse of PIVOT. It takes a "wide" table and transforms it back into a "long" format by turning columns into rows. This is useful when you receive data that is already pivoted (like a spreadsheet) and need to normalize it for easier processing or joining.
The best resource for this is the official Databricks documentation.
UNPIVOT clause | Databricks on AWS
The Databricks documentation provides the definitive syntax and examples for the UNPIVOT clause.
Please read the following sections of the documentation: Read the introduction at the top to understand its purpose. Review the "Parameters" section to learn about value_column and unpivot_column. Carefully study the first example under the "Examples" section, titled "A single column UNPIVOT". This shows exactly how to deconstruct a pivoted table.
Deconstructing the UNPIVOT Syntax
UNPIVOT is conceptually simpler than PIVOT because it doesn't involve aggregation.
- Value Column: The name of the new column that will hold the values from the original wide columns (e.g.,
sales). - Name Column: The name of the new column that will hold the names of the original wide columns (e.g.,
quarter). - Columns to Unpivot: Specified in the
INclause, this is the list of columns you want to turn into rows.
4. Hands-On Practice with UNPIVOT
Let's use UNPIVOT to reverse our previous exercise.
Step 1: Create the Pivoted (Wide) Data
First, let's create a temporary view from our PIVOT result so we can query it directly.
CREATE OR REPLACE TEMPORARY VIEW pivoted_sales AS
SELECT * FROM sales_data
PIVOT (
  SUM(amount) FOR quarter IN ('Q1', 'Q2', 'Q3', 'Q4')
);

-- View the pivoted data
SELECT * FROM pivoted_sales;
Step 2: Unpivot the Data
Now, write an UNPIVOT query to transform pivoted_sales back to its original long format.
SELECT * FROM pivoted_sales
UNPIVOT (
  amount
  FOR quarter IN (Q1, Q2, Q3, Q4)
);
Result:
This query will produce a result that looks almost identical to our original sales_data table, completing the round trip and demonstrating the inverse relationship between PIVOT and UNPIVOT.
Conclusion
You've now learned how to fundamentally reshape your data's structure using Spark SQL. This is a critical skill for any data engineer, as preparing data for analysis often involves moving between long and wide formats.
Key Takeaways
PIVOTrotates rows into columns, creating a "wide" table. It requires an aggregate function (SUM,AVG, etc.).UNPIVOTrotates columns into rows, creating a "long" table. It does not perform aggregation.- The
PIVOTclause relies on an aggregate, aFORclause for the pivot column, and anINclause for the new column names. - The
UNPIVOTclause defines a value column, a name column, and anINclause listing the columns to be unpivoted.
Next Steps
In our next lesson, we will continue exploring transformations by tackling complex data types. You will learn how to parse and extract fields from nested JSON data and how to flatten arrays using the EXPLODE function, another essential tool for handling modern, semi-structured data sources.