Introduction
In the previous module, we finalized the architectural blueprint for our N-of-1 crossover experiment. We established a randomized treatment sequence for the different living arrangements, specified blocking factors to control for external events, and designed protocols to manage potential biases like demand characteristics and carryover effects. With the experimental design now in place, our focus must shift to what is arguably the most critical component: the data we will collect. A sophisticated experiment is only as good as the measurements it yields.
This lesson marks our entry into the third module, "Advanced Measurement for Interdependent Actors." Our objective is to design a multi-dimensional satisfaction instrument tailored to the vee roles, mitigating potential floor and ceiling effects. We will move from the abstract concept of "satisfaction" to a concrete, psychometrically sound measurement tool. This involves defining the construct in the unique context of a vee relationship, generating appropriate questions (items), and building in features to ensure our instrument is sensitive enough to capture the very changes we aim to detect.
1. Defining the Construct: What is "Satisfaction" in a Vee Triad?
The first and most fundamental step in measurement is operationalization: creating a precise, measurable definition of our latent construct. As your background in research methodology has shown, a vague definition leads to an invalid instrument.
To begin, let's consider the general process of scale development.
Webinar - Scale Development and Validation: A thorough guide on how to develop and validate a scale
This video, "Scale Development and Validation," provides an excellent overview of the entire process. For now, we will focus on the foundational first step.
Please watch the segment on operational definition. The presenter emphasizes that every subsequent step—item generation, dimensionality—is guided by this initial definition and its fit with the research context.
Our context is a three-person vee relationship, which is more complex than a dyad. Is satisfaction a single, monolithic feeling, or is it composed of distinct facets? This question of dimensionality is central. A useful parallel can be found in research on friendship networks, which, like our triad, involve multiple interconnected relationships.
[PDF] Friendship Network Satisfaction: A multifaceted construct scored as ...
This paper details the development of a satisfaction scale for friendship networks. It provides a superb example of grappling with the dimensionality of a social construct.
Read the introduction and the section titled "Evaluating friendships: How many dimensions do you need?". Note the debate among scholars: is friendship satisfaction about closeness, enjoyment, utility, or a combination? The authors' goal was to empirically test these competing models.
Inspired by this approach, we must hypothesize the dimensions of satisfaction specific to our vee triad. These dimensions will likely differ based on an individual's role as the pivot (W) or a partner (M1, M2). A literature review on polyamorous relationships combined with general relationship science might suggest the following structure:
Hypothesized Dimensions of Triadic Satisfaction:
- For all members (W, M1, M2):
- Emotional Security: A sense of stability, trust, and confidence in one's place within the relationship structure.
- Relational Equity: The perception that one's needs are considered fairly and that relational dynamics are balanced.
- For the Pivot (W):
- Autonomy: The freedom to manage her time, energy, and emotional connections without feeling excessively constrained or pulled between partners.
- Integrative Well-being: The feeling that her multiple relationships are harmoniously integrated rather than siloed or in conflict.
- For the Partners (M1, M2):
- Compersion: Experiencing joy, happiness, or fulfillment from witnessing their shared partner's happiness with the other partner.
- Individual Connection: The perceived quality of the one-on-one bond with the pivot, independent of the triad structure.
These are our starting hypotheses. The process of scale development, which we will outline, is designed to empirically validate, refine, or reject this proposed dimensional structure.
2. Item Generation and Addressing Measurement Limits
With our dimensions defined, the next step is to generate a pool of items—the specific questions or statements that will measure each dimension. This process involves drawing from existing scales, a deep literature review, and in an ideal scenario, qualitative interviews with the target population.
However, a critical problem often emerges with standard Likert-scale questions (e.g., "Rate your satisfaction from 1 to 5"): floor and ceiling effects.
Skewness: Floor & Ceiling Effects
This short video provides a clear and intuitive explanation of floor and ceiling effects.
Watch the full video (Floor & Ceiling Effects) to understand how these measurement limitations arise when a scale is too easy (ceiling effect) or too hard (floor effect), leading to skewed data where true variability is lost.
A ceiling effect would be disastrous for our experiment. If a living arrangement is highly successful, we might find all three participants consistently rating their satisfaction as "5 out of 5." This clustering of scores at the maximum makes it impossible to distinguish a "very good" arrangement from an "outstandingly good" one. The instrument's upper limit is hit, and we lose all statistical sensitivity.

To overcome this, we can adopt a more sophisticated approach than a simple Likert scale. A cutting-edge method involves combining Multistage Testing (MST) with open-ended questions.
Breaking the Ceiling: Mitigating Extreme Response Bias in Surveys ...
This paper presents a novel framework for overcoming ceiling effects in psychological measurement. Its principles are directly applicable to our design challenge.
Please read the following sections: The Introduction and Section 2.1, "The Ceiling Effect." These sections define the problem and explain why simple fixes often fail for extreme psychological states. Section 3, "Methods," especially the subsections on how the design works. Focus on how it uses a routing question to assign respondents to modules and then uses open-ended questions of varying "harshness" to elicit more nuanced responses. The beginning of Section 3.3, which describes how questions are structured within each module.
The logic of this MST approach is powerful. Instead of asking "How satisfied are you (1-5)?", we can structure our measurement as follows:
- Routing Question: Start with a simple, global rating: "On a scale of 1-10, how would you rate your overall satisfaction with the relationship this week?"
- Module Assignment: Based on the answer, the participant is routed to a specific module of open-ended questions.
- Low Score (1-4) -> "Challenges" Module
- Mid Score (5-7) -> "Mixed Experience" Module
- High Score (8-10) -> "Highlights" Module
- Tailored Open-Ended Items: Each module contains questions designed to probe that specific level of satisfaction. This forces a qualitative justification, making it much harder to simply "max out" the scale.
- Example from "Highlights" Module (probing Compersion): "Describe a moment this week when seeing your partners happy together brought you a sense of joy or contentment. What did that feel like?"
- Example from "Challenges" Module (probing Relational Equity): "Describe a situation this week where you felt your needs or schedule were not given fair consideration. What was the impact on you?"
The responses to these open-ended questions would then be scored—either by trained raters or, as the paper suggests, potentially by a fine-tuned large language model—according to a pre-defined rubric to generate a quantitative score. This method provides the granularity needed to differentiate between "very high" and "extremely high" satisfaction, effectively breaking the ceiling.
3. A Roadmap for Instrument Development
We now have the core components: a hypothesized set of dimensions and a sophisticated design (MST with open-ended items) to measure them. The full development process is an iterative cycle of generation, refinement, and validation.
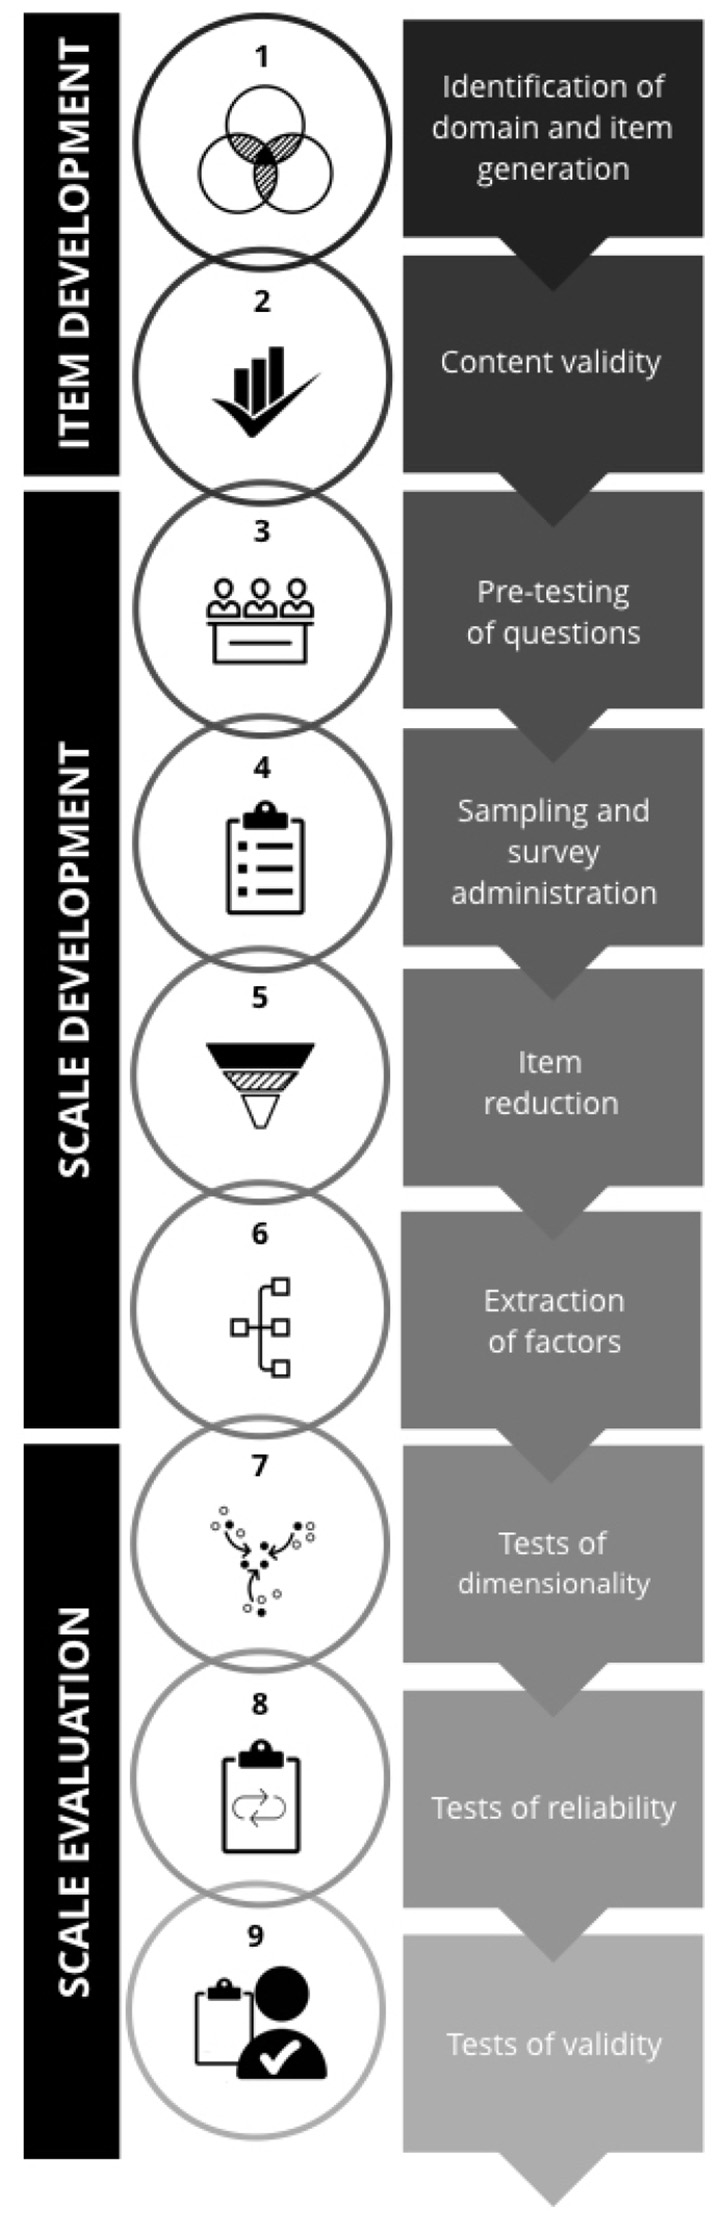
The paper on Friendship Network Satisfaction (LINK) provides a perfect case study of this process in action. They began with hundreds of items and used a combination of statistical analysis and qualitative feedback to arrive at a refined, validated scale.
[PDF] Friendship Network Satisfaction: A multifaceted construct scored as ...
This paper is our blueprint. It demonstrates the rigorous, multi-step process required to build a valid measurement instrument.
Please review the following sections to understand the key steps: "Overview of the current studies": This section introduces the core analytical plan, including the use of bi-factor models to test whether a multifaceted construct can still be represented by a single score. "Measures" (in Study 1): Read how the authors generated and reduced their initial item pool. This is the practical work of item generation. "Preliminary item review and exploratory factor analysis": See how they used Exploratory Factor Analysis (EFA) to empirically discover the underlying dimensions in their data, which they labeled Closeness, Socializing, and Negativity. This is how we would test our own hypothesized dimensions. "Item response theory (IRT)": This section explains how they used IRT to select the most effective items—those best at differentiating between individuals. "Study 2": Skim this study to see how they iteratively refined the scale and confirmed its structure, resulting in the final instrument.
Your background in statistics makes you well-equipped to appreciate this rigorous process. In our own project, after generating items for our hypothesized dimensions, we would follow a similar path:
- Expert Review & Pre-testing: Get feedback on item clarity and relevance from relationship experts and a small sample from the target population.
- Pilot Study: Administer the full item pool to a larger sample of individuals in vee relationships.
- Exploratory Factor Analysis (EFA): Analyze the pilot data to see which items cluster together. Does the data support our hypothesized dimensions of Autonomy, Compersion, etc.? Or does a different structure emerge?
- Item Response Theory (IRT): Analyze item discrimination and difficulty to discard poorly performing items and retain those that provide the most information across the spectrum of satisfaction.
- Confirmatory Factor Analysis (CFA): On a new dataset, confirm that the refined factor structure holds.
- Reliability and Validity Testing: Calculate metrics like composite reliability (a measure of internal consistency) and establish convergent and discriminant validity to ensure the dimensions are both coherent and distinct. The "Scale Development and Validation" video provides a practical walkthrough of these final checks using tools like Average Variance Extracted (AVE).
This systematic process ensures that the final instrument is not just a collection of questions, but a scientifically validated tool capable of producing reliable and meaningful data.
Conclusion
In this lesson, we have laid out the comprehensive design process for creating a custom, multi-dimensional satisfaction instrument for our N-of-1 experiment. We moved from theory to a practical, step-by-step blueprint.
Our key takeaways are:
- Start with Operationalization: The first step is to define the construct by hypothesizing its key dimensions, tailored to the unique roles within the vee triad (e.g., Autonomy, Compersion, Equity).
- Design for Sensitivity: Standard Likert scales are vulnerable to floor and ceiling effects, which can mask important variations in satisfaction.
- Use Advanced Methods: A hybrid approach combining Multistage Testing (MST) with open-ended questions offers a powerful way to mitigate ceiling effects by requiring qualitative descriptions to achieve high scores, providing more granular data.
- Follow a Rigorous Process: Instrument development is an iterative process involving item generation, expert review, and a sequence of statistical analyses (EFA, IRT, CFA) to refine the item pool and validate the final scale's structure, reliability, and validity.
We now have the what—the design of our measurement tool. In the next lesson, we will address the when and how often. We will specify a measurement schedule (e.g., using daily diaries) that balances the need for detailed, granular data against the risk of participant fatigue and reactivity.