Hello! Welcome back to our course on C++ for the ESP32.
In the last lesson, you mastered the fundamental development cycle: building, flashing, and monitoring your application. You saw how to get basic output to your serial monitor using std::cout. While functional, this approach is like using a simple multimeter for all your diagnostics; it works, but for complex systems, you need more specialized tools.
This lesson introduces a professional-grade diagnostic tool: the ESP-IDF logging framework. You will learn how to use its powerful functions to generate structured, color-coded, and filterable debugging output. This is a crucial skill for writing and debugging any non-trivial embedded application. Specifically, we will focus on using the logging functions to output messages at different severity levels.
1. Beyond printf: The Power of Structured Logging
In any complex project, from mechanical systems to software, you need a way to monitor what's happening internally. Simply printing every piece of information (printf or std::cout) quickly leads to a cluttered and unmanageable stream of data. A structured logging system solves this by allowing you to categorize messages by importance and origin.
The ESP-IDF provides this through the esp_log.h library. To understand its core components, please read the following material.
ESP-IDF tutorial series: Logging
This article from Espressif's developer blog, 'ESP-IDF tutorial series: Logging', provides an excellent introduction to the core concepts of the logging framework. It clearly explains why it's superior to printf and details its fundamental building blocks.
Please read from the beginning of the article down to the end of the 'Verbosity' section. Focus on understanding the three core elements: Tags, Logging macros, and Verbosity levels.
As you've just read, the system is built on three key ideas:
- Tags: A simple string (e.g.,
"MOTOR_CONTROL","WIFI_SETUP") used to label and group messages from a specific part of your code. This helps you immediately identify the source of a log message. - Logging Macros: A family of functions,
ESP_LOGx, wherexcorresponds to a severity level. - Verbosity Levels: A setting that controls the minimum severity level of messages that will actually be printed.
2. The Five Levels of Logging
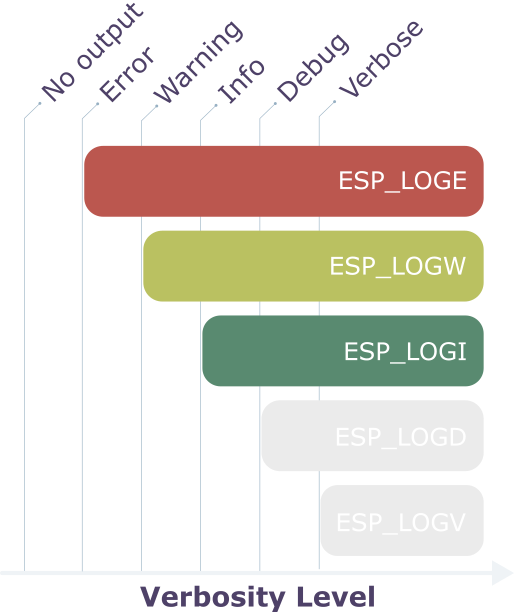
The ESP-IDF defines five severity levels, each with its own macro. In your C++ code, you will include the header #include "esp_log.h" to use them.
| Macro | Level | Color | Purpose |
|---|---|---|---|
ESP_LOGE |
Error | Red | Critical errors, failures that halt a functionality. |
ESP_LOGW |
Warning | Yellow | Unexpected events or potential issues. |
ESP_LOGI |
Info | Green | Major lifecycle events (e.g., "WiFi connected"). |
ESP_LOGD |
Debug | White | Detailed information for debugging specific functions. |
ESP_LOGV |
Verbose | White | The most detailed information, for fine-grained tracing. |
The key concept is that setting a verbosity level (e.g., Info) will show messages at that level and all levels above it (Info, Warning, and Error).
3. Putting Logging into Practice
Let's modify the cpp_project from our previous lessons to use the logging framework.
- Open your
main.cppfile. - Include the logging header at the top:
#include "esp_log.h" - Just before
app_main, define a tag for this file:static const char* TAG = "MAIN"; - Replace the contents of your
app_mainfunction with the following code. This code logs one message at each severity level and then enters the familiar counting loop.
#include <iostream>
#include "freertos/FreeRTOS.h"
#include "freertos/task.h"
#include "esp_log.h"

// Define a tag for this file's log messages
static const char* TAG = "MAIN";

extern "C" void app_main(void)
{
    // Log one message at each level
    ESP_LOGE(TAG, "This is an error message.");
    ESP_LOGW(TAG, "This is a warning message.");
    ESP_LOGI(TAG, "This is an info message.");
    ESP_LOGD(TAG, "This is a debug message.");
    ESP_LOGV(TAG, "This is a verbose message.");

    int count = 0;
    while (1) {
        ESP_LOGI(TAG, "Loop count: %d", count++);
        vTaskDelay(pdMS_TO_TICKS(1000));
    }
}
Now, build, flash, and monitor your project using the combined command you learned in the last lesson:idf.py flash monitor
You should see an output similar to this:

You'll notice that only the Error, Warning, and Info messages are printed. The Debug and Verbose messages are missing. This is because the default log verbosity for a new ESP-IDF project is set to Info.
4. Controlling Global Log Verbosity
To see the Debug and Verbose messages, you need to change the project's default log verbosity level. The primary way to do this is through the project configuration menu, menuconfig.
ESP32 - Kconfig with ESP-IDF Tutorial
This video by Shawn Hymel provides a concise, practical demonstration of how to change the log verbosity. Watching someone go through the steps is often the quickest way to learn.
Watch from 8:28 to 10:02. This section shows exactly how to navigate the menuconfig interface to find and change the 'Default log verbosity'. Follow along and change the setting in your own project.
To summarize the process:
- Exit the monitor (
Ctrl+]). - Run
idf.py menuconfig. - Navigate to
Component Config->Log output. - Select
Default log verbosity. - Change the setting from
InfotoVerbose. - Save the new configuration and exit
menuconfig.
Now, run idf.py flash monitor again. Because you changed the configuration, the project will recompile. Once it's running, you will see all five of your log messages appear in the monitor, including the white Debug and Verbose ones.
Test your understanding!
After setting the log level to Verbose and seeing all messages, you go back into menuconfig and change the Default log verbosity to Warning. After you save, build, and flash, which of your five initial ESP_LOGx messages will appear in the monitor?
Show answer
Only the ESP_LOGE (Error) and ESP_LOGW (Warning) messages will appear. The Warning level includes messages at that severity and any higher severities (in this case, only Error). Info, Debug, and Verbose messages will be suppressed.
5. Finer-Grained Control
While menuconfig is great for setting a project-wide default, sometimes you need more dynamic or specific control. The ESP-IDF provides two powerful ways to do this.
ESP-IDF tutorial series: Logging
The Espressif logging tutorial also covers more advanced filtering techniques. These are extremely useful for focusing on a specific problem without being overwhelmed by logs from other parts of the system.
Please read the section titled 'Filtering Logs', including the subsections 'Filtering at Runtime' and 'Filtering in the IDF Monitor'.
Runtime Control with esp_log_level_set()
You can change the verbosity for a specific tag while your code is running. This is perfect for temporarily increasing the detail level for a module you are actively debugging, without flooding the console with verbose logs from other, stable parts of your code.
For example, to temporarily silence all but the most critical messages from our MAIN tag, you could add this line:esp_log_level_set(TAG, ESP_LOG_ERROR);
After this line executes, only ESP_LOGE(TAG, ...) messages will be printed for that tag.
Monitor-Side Filtering with --print-filter
This is arguably one of the most powerful features for debugging. It allows you to filter the log output on your computer without changing the code on the ESP32 at all. The ESP32 sends all messages (up to the menuconfig verbosity limit), but idf.py monitor only shows you what you ask for.
For example, to see only Debug-level messages (and higher) from the MAIN tag, and only Errors from all other tags (*), you would start the monitor like this:idf.py monitor --print-filter="MAIN:D *:E"
This allows you to zero in on a problem area instantly.
Conclusion
You have now moved from basic printf-style debugging to a robust, structured logging system. This is a significant step toward writing clean, maintainable, and easily debuggable embedded software.
Key takeaways from this lesson include:
- The ESP-IDF logging framework (
esp_log.h) is superior toprintffor its structure, severity levels, and configurability. - Messages are categorized using tags (for origin) and macros like
ESP_LOGI(for severity). - The global log verbosity is set project-wide using
idf.py menuconfig, which controls which messages are compiled into your binary. - You can dynamically adjust log levels for specific tags at runtime using
esp_log_level_set(). - You can filter the output in the
idf.py monitorusing the--print-filterargument for on-the-fly debugging without recompiling.
In the next lesson, we will use the skills you've just acquired to interpret the ESP32's boot messages. The flood of text you see when the device first starts is actually a series of log messages. Understanding them is key to diagnosing common startup issues, like problems with power, flashing, or hardware configuration.