Hello. The previous lesson showed how to translate a relative effect into events per 1,000 and how a confidence interval qualifies that estimate. Here, the same arithmetic helps answer a different question: how does the cardiovascular benefit of statins differ between preventing a first event and preventing another event after cardiovascular disease is established?
You will compare worked cases over the same five-year period, then check them against trial-based estimates. Throughout, keep major cardiovascular events, vascular deaths, and deaths from any cause separate. A treatment can prevent a heart attack or stroke without every prevented event representing a life saved.
Start with the outcome and the starting risk
Primary prevention means trying to prevent a first cardiovascular event in someone without established cardiovascular disease. Secondary prevention means trying to prevent further events in someone who already has it—for example, after a heart attack. A prior event often signals a higher chance of another, but the label alone does not give you a person’s numerical risk.
For either group, the absolute benefit depends on two quantities: the baseline risk of a specified outcome over a specified period, and how much treatment reduces that risk proportionally. If the proportional reduction were the same in two groups, more events would generally be prevented in the group where more events were expected to begin with.
The US Preventive Services Task Force (USPSTF) explains that principle for primary prevention and reports pooled trial results for several different outcomes. Read these passages with the outcome labels in view.
Read the USPSTF recommendation to see how baseline risk affects expected benefit, then compare its reported cardiovascular-event and mortality results.
In the discussion of who may benefit, read the risk discussion, beginning with “The likelihood that a patient will benefit” and ending with the sentence about a person choosing to initiate a statin. Note both the comparison of 10-year risk groups and the warning that risk estimates are imprecise. Then find the paragraph beginning “In pooled analyses, statin therapy was associated”. Read the pooled results and continue through that paragraph’s final absolute-risk-difference figure. Focus on which numbers concern deaths, heart attacks, strokes, or a composite cardiovascular outcome; the trials did not all define the composite identically.
In that pooled primary-prevention analysis, the reported absolute risk difference for composite cardiovascular outcomes was percentage points, or about 13 fewer outcomes per 1,000 across the trials’ follow-up periods. The corresponding figure for death from any cause was percentage points, or about 3 to 4 fewer deaths per 1,000. These are results for different outcomes, assembled from different sets of trials. They are not two interchangeable estimates of “lives saved,” and the source does not present both as a single standardized five-year comparison.
Two worked cases over five years
To isolate the effect of starting risk, suppose that an LDL-cholesterol reduction of about 1 mmol/L produces an approximately 20% proportional reduction in major vascular events in two example groups. That is a rounded, trial-informed assumption for this comparison—not a promise about an individual.
| Illustrative group | Major vascular events without treatment, over 5 years | With a 20% proportional reduction | Absolute difference |
|---|---|---|---|
| Primary prevention: no prior cardiovascular event; assumed 5-year risk of 3% | 30 per 1,000 | 24 per 1,000 | 6 fewer events per 1,000 |
| Secondary prevention: prior cardiovascular event; assumed 5-year risk of 30% | 300 per 1,000 | 240 per 1,000 | 60 fewer events per 1,000 |
For the primary-prevention case, 20% of 30 expected events is 6. For the secondary-prevention case, 20% of 300 is 60. The proportional reduction is identical; the absolute reduction is ten times larger because the assumed baseline risk is ten times larger. These are illustrative baseline risks, not estimates for every person in either category. The table also says nothing yet about deaths: its outcome is major vascular events.
Now connect that arithmetic to the randomized-trial meta-analysis by the Cholesterol Treatment Trialists’ (CTT) Collaboration. Its participants were grouped by predicted five-year risk of major vascular events. Low-risk trial populations were commonly primary-prevention populations, while participants at higher risk commonly had previous vascular disease—but risk category and prevention category were not identical.
Read the CTT Collaboration’s analysis to connect prevention categories with its five-year risk groups and to see a measured absolute event reduction in lower-risk participants.
In the Results discussion of predicted risk, find the paragraph beginning “When trials were ordered by their median”. Read the trial populations through its sentence about dialysis patients. Notice which trials were primary prevention and why a high predicted risk does not necessarily mean a previous vascular event. Then go to Discussion. In the paragraph beginning “The estimated absolute reduction in major vascular events”, read the absolute results through the end of that paragraph. Focus first on the approximately 11 events prevented per 1,000 over five years for each 1 mmol/L LDL reduction among participants with predicted five-year risk below 10%; also notice that the authors say potential harms must be considered.
The CTT estimate of about 11 fewer major vascular events per 1,000 over five years refers to its combined group with predicted five-year risk below 10%. It is not an estimate specifically for everyone whose risk is 3%, nor exclusively for people without previous disease. Our worked table uses one precisely stated, hypothetical baseline risk in each row; the trial analysis groups people across ranges of risk.
Read events and deaths as separate results
The CTT figure below makes the risk comparison more concrete. Panel A estimates major vascular events avoided; panel B estimates vascular deaths avoided. Both use the same five-year risk categories and show results for several sizes of LDL-cholesterol reduction. They are trial-based estimates across risk groups, not counts observed in the two invented groups in our table.
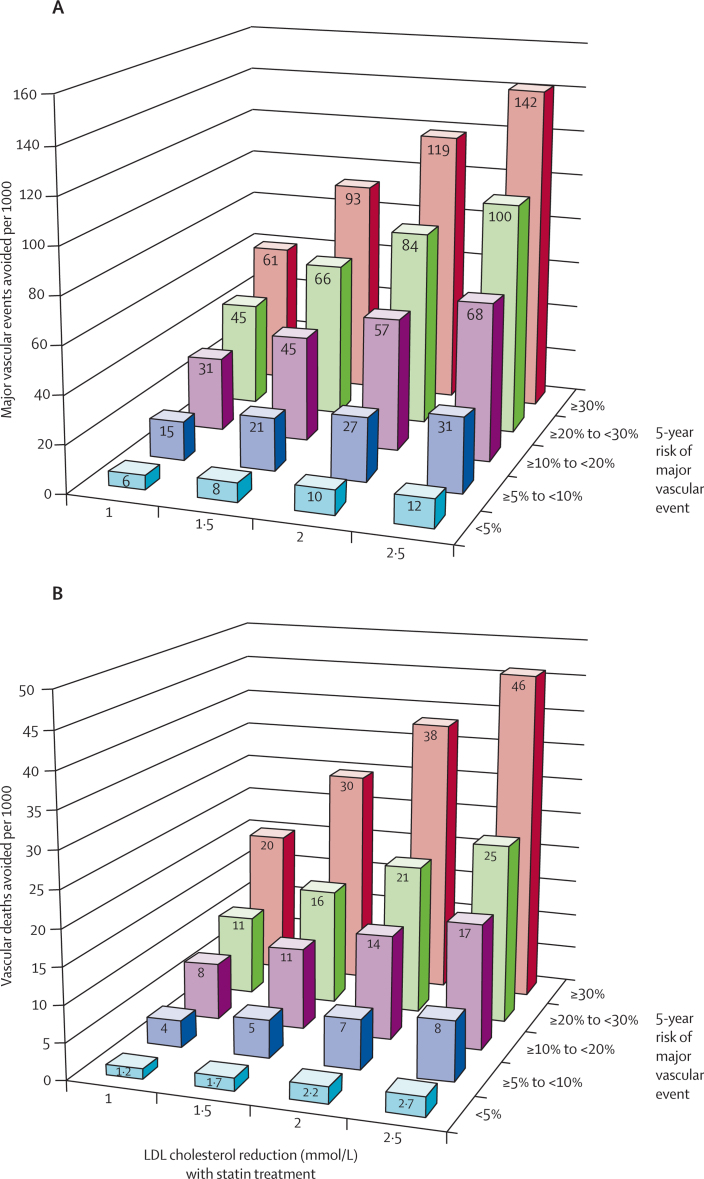
Look along the 1 mmol/L LDL-reduction position in each panel. In the under-5% five-year risk category, the estimates are about 6 major vascular events and 1.2 vascular deaths avoided per 1,000 over five years. In the 30%-or-higher risk category, they are about 61 major vascular events and 20 vascular deaths avoided per 1,000. The event estimates resemble the scale of our worked cases, but they come from the figure’s risk groups and modelling, not from our assumed risks of exactly 3% and 30%.
Two interpretations matter:
- “61 events avoided” does not mean “61 deaths avoided.” Major vascular events include outcomes other than death; the figure supplies a separate vascular-death estimate of about 20 for that higher-risk group.
- “20 vascular deaths avoided” is not an all-cause mortality estimate. All-cause mortality includes deaths from cardiovascular and non-cardiovascular causes.
Read the CTT mortality discussion to see why deaths, particularly within lower-risk groups, require their own evidence rather than an inference from the event count.
Return to the CTT analysis for its separate mortality findings and its caution about interpreting deaths in low-risk groups.
In Results, find the paragraph beginning “In all participants, there was a proportional reduction in vascular mortality”. Read the mortality results through that paragraph’s end. Focus on the statement that there were too few deaths among lower-risk participants for a reliable direct assessment within those risk categories, and distinguish it from the reported combined results for participants with no history of vascular disease.
A lower-risk category can show a reasonably clear reduction in events yet contain too few deaths to estimate its own mortality effect precisely. That does not erase the event benefit, and it does not establish a particular number of lives saved in that category. The CTT analysis also reports reductions in vascular and all-cause mortality when it pools participants without a history of vascular disease; that is a different grouping from one narrow, low-risk band.
Make a comparison that can inform a decision
When comparing benefit figures, first match their time period, outcome, and treatment contrast. A five-year estimate for major vascular events cannot be set directly beside a ten-year risk of heart attack alone, or beside an all-cause death estimate pooled across trials with different follow-up periods. Likewise, the expected reduction can differ with the LDL reduction achieved; the figure’s columns should not be read as four predictions for one unchanged treatment.
For a clinician conversation, the useful form is specific: “Given an estimated baseline risk over this period, about how many people per 1,000 might avoid a defined cardiovascular event with treatment, and what is known separately about deaths?” Risk estimates are imperfect, and individual treatment decisions also depend on potential harms and preferences. These examples explain population averages; they cannot identify whether a particular person will be the one whose event is prevented. They are not a reason to change medication independently.
Key takeaways
Primary prevention aims to prevent a first event; secondary prevention aims to prevent another. Higher baseline risk usually produces a larger absolute event benefit for the same proportional risk reduction, as the five-year worked cases illustrate. But prevention labels do not substitute for a measured baseline risk.
Always name the outcome: major vascular events avoided, vascular deaths avoided, and deaths from any cause are different claims. The next lesson begins the benefits-and-harms side of the course by examining how blinded statin-versus-placebo trials estimate muscle symptoms attributable to treatment.