Hello! Welcome to your next lesson.
In our previous session, we focused on managing the structure of your Delta tables by implementing schema evolution with mergeSchema and overwriteSchema. This allows your pipelines to adapt to changes in source data schemas.
Today, we shift our focus from the structure of the data to its history. For any production data asset, it's critical to know its lineage: what changes were made, when were they made, and who made them? This is essential for auditing, compliance, debugging, and maintaining data quality.
This lesson covers how to use DESCRIBE HISTORY to audit Delta table changes. You'll learn how to access the detailed transaction log for any Delta table and query it to answer critical questions about the data's lifecycle.
By the end of this 60-minute lesson, you will be able to:
- Understand the purpose and structure of a Delta table's history.
- Execute the
DESCRIBE HISTORYcommand to view the transaction log. - Interpret the output, including version, timestamp, operation type, and performance metrics.
- Write SQL queries against the history to perform common auditing tasks.
This is the final lesson in our "Advanced Delta Lake Features" module. Let's complete your deep dive into Delta!
Part 1: The Foundation of Auditing: Table History
Every operation that modifies a Delta table—whether it's an INSERT, UPDATE, DELETE, MERGE, or a schema change—is recorded as a transaction. Delta Lake automatically versions your data as you make these changes and logs them in a transaction log. The DESCRIBE HISTORY command is your window into this log.
To understand the practical importance of this, let's consider a common scenario.
A Data Practitioner's Guide - Managing Delta Table History
This article from the Databricks community blog frames the use of DESCRIBE HISTORY in a real-world scenario involving a compliance request. It's a great way to understand the 'why' behind the command.
Read the section 'Time Travel and Auditing - History'. Focus on the scenario presented and the simple DESCRIBE HISTORY command used to address it. Note the default log retention period mentioned.
As the article highlights, DESCRIBE HISTORY is the key to auditing. But what information does it actually provide? Let's look at the schema of the output.
How to Evaluate Delta Table Operational Health Using Delta Table History
To use the history effectively, you need to know what columns are available. This article provides a clear breakdown of the schema returned by the DESCRIBE HISTORY command.
Read the section 'Quick look into Delta Table History' and pay close attention to the table that describes the columns like version, timestamp, operation, and especially operationMetrics.
Here's a summary of the most important columns for auditing:
| Column | Description |
|---|---|
version |
The version number of the table after the commit. |
timestamp |
The timestamp of when the commit was made. |
userId / userName |
The user who performed the operation. |
operation |
The name of the operation (e.g., WRITE, UPDATE, DELETE, MERGE, CREATE TABLE). |
operationParameters |
A map of the parameters passed to the operation (e.g., WHERE clauses). |
operationMetrics |
A map of key metrics about the operation (e.g., numOutputRows, numTargetFilesAdded). |
clusterId |
The ID of the cluster that performed the operation. |
This rich set of metadata provides a complete audit trail for your table.

Part 2: Seeing DESCRIBE HISTORY in Action
Now, let's see how different DML operations populate the history log. The following video provides a great, step-by-step demonstration.
Internals of Delta Lake | Databricks | Lakehouse | Deep Dive into Delta Lake
This video from The Data Master walks through several DML operations and shows how each one is recorded in the Delta table's history. It connects the logical operations to the underlying file changes and history log.
Watch the following segments to see how different operations are audited: 15:10 - 16:18: See the initial output of DESCRIBE HISTORY after creating a table and performing several WRITE operations. 16:18 - 21:03: Observe how an UPDATE operation is captured, paying close attention to the operationMetrics that show both added and removed files. 21:03 - 26:58: Watch how a DELETE operation is logged. Notice that the data files aren't immediately deleted but are marked for removal, and this is tracked in the history.
The video demonstrates a key concept: Delta Lake operations are often "copy-on-write." When you update or delete rows, Delta doesn't modify existing data files. Instead, it writes new files containing the changes and updates the transaction log to point to these new files, marking the old ones as no longer part of the current version. DESCRIBE HISTORY makes this process visible through metrics like numFilesAdded and numFilesRemoved.
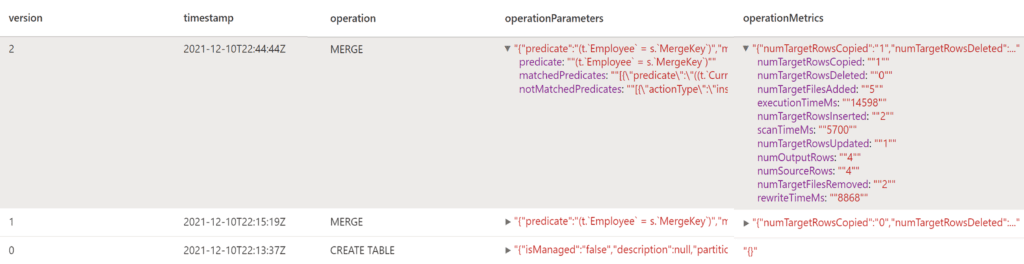
Hands-On Lab: Your Turn to Audit
Time to put this into practice. Open a new Databricks notebook and run the following commands to see the history evolve in real-time.
Step 1: Create a Table
Let's create a simple table to track user activity.
-- Use SQL for this exercise
%sql

CREATE OR REPLACE TABLE user_activity (
  user_id INT,
  activity STRING,
  activity_time TIMESTAMP
);

-- Check the history. You should see one 'CREATE OR REPLACE TABLE' operation.
DESCRIBE HISTORY user_activity;
Step 2: Insert Data
Now, let's add some data in a few separate transactions.
-- Insert a single row
INSERT INTO user_activity VALUES (101, 'login', NOW());

-- Insert multiple rows in one statement
INSERT INTO user_activity
VALUES
  (102, 'view_dashboard', NOW()),
  (101, 'run_query', NOW());

-- Check the history again. You will see two new 'WRITE' operations.
DESCRIBE HISTORY user_activity;
Step 3: Update Data
Let's update a record.
UPDATE user_activity
SET activity = 'logout'
WHERE user_id = 101 AND activity = 'login';

-- Check the history. Notice the 'UPDATE' operation and its metrics.
-- How many files were added and removed for this simple update?
DESCRIBE HISTORY user_activity;
Step 4: Delete Data
Finally, let's delete a record.
DELETE FROM user_activity
WHERE user_id = 102;

-- Check the history one last time. You'll see the 'DELETE' operation.
DESCRIBE HISTORY user_activity;
By running these simple commands, you've directly observed how DESCRIBE HISTORY provides a complete and immutable record of every change to your table.
Part 3: Advanced Auditing with SQL
Viewing the history is useful, but the real power comes from querying it. Since you have a strong background in SQL and data engineering, you can treat the history output as a data source for building powerful audit reports.
The following resource provides excellent, practical examples of how to do this.
How to Evaluate Delta Table Operational Health Using Delta Table History
This article demonstrates how to build KPIs and audit reports by writing SQL queries directly against the DESCRIBE HISTORY output. This is a perfect example of a professional-level use case.
Read the sections 'Change Volume' and 'Most Active Users/Jobs Impacting Table'. Study the SQL queries provided. You don't need to run them now, but focus on understanding the pattern: using a Common Table Expression (CTE) to capture the history and then aggregating it to find insights.
Let's break down the logic from the article.
Example 1: Auditing Change Volume
Imagine you need to report on how much a table changes each day. Is it mostly inserts, or are there many updates? You can answer this by querying the history.
-- This query shows how to calculate daily change volume by operation type.
-- It's adapted from the article for clarity.
WITH history_snapshot AS (
  DESCRIBE HISTORY user_activity
)
SELECT
  CAST(timestamp AS DATE) AS operation_date,
  operation,
  SUM(operationMetrics.numOutputRows) AS total_rows_affected,
  SUM(operationMetrics.numFilesAdded) AS total_files_added
FROM history_snapshot
GROUP BY ALL
ORDER BY operation_date DESC, operation;
This query gives you a high-level summary of table activity, which is useful for monitoring data pipeline health and identifying unexpected changes.
Example 2: Identifying Active Users
In a collaborative environment, you might need to know who is modifying a critical table.
-- This query identifies the users who have performed the most operations.
WITH history_snapshot AS (
  DESCRIBE HISTORY user_activity
)
SELECT
  userName,
  operation,
  COUNT(*) as num_operations
FROM history_snapshot
WHERE userName IS NOT NULL
GROUP BY ALL
ORDER BY num_operations DESC;
This is a powerful auditing technique for governance and security, helping you understand data access and modification patterns within your team.
Conclusion
Congratulations on completing the "Advanced Delta Lake Features" module! In this lesson, you've mastered a critical feature for data governance and operations.
Key Takeaways:
DESCRIBE HISTORYis your command-line interface to the Delta transaction log, providing a complete audit trail of all table modifications.- The history details what changed (
operation), when (timestamp), who (userName), and the impact (operationMetrics). - Understanding the metrics for
UPDATEandDELETEoperations reveals Delta Lake's copy-on-write mechanism. - You can query the history output using SQL to create sophisticated audit reports, monitor table health, and track user activity.
Preview of the Next Module:
So far, we've focused on managing and querying data that is already in Delta Lake. But how does the data get there in the first place? In our next module, "Incremental Data Ingestion," we will shift our focus to building robust, scalable ingestion pipelines. We'll start with Auto Loader, Databricks' powerful service for incrementally and efficiently processing new data files as they arrive in cloud storage.