Welcome to the final lesson of your database design course! Over the past several lessons, we have journeyed from understanding basic concepts like entities and attributes, through defining relationships and keys, and finally into the rigorous process of normalization up to Third Normal Form (3NF). In our last session, you honed your analytical skills by evaluating existing tables to determine their level of normalization.
Today, we will synthesize all of this knowledge. The goal of this lesson is to construct a complete Entity-Relationship Diagram (ERD) that accurately represents a database schema after it has been normalized to 3NF. This is the final blueprint a designer creates before implementation, and mastering this skill will tie together everything you've learned, preparing you for your upcoming project and exam.
1. From Normalized Tables to a Visual Blueprint
After the normalization process, you are left with a set of well-structured tables, each in 3NF. While these tables are efficient and free of redundancy, their relationships can be hard to see when they are just lists of columns. An ERD translates this normalized structure into a clear, visual map.
An ERD that represents a 3NF schema will have the following characteristics:
- Each table from your normalized schema becomes an entity in the diagram.
- The columns of each table become the attributes of the corresponding entity.
- Primary Keys (PKs) are clearly marked to identify unique records.
- Foreign Keys (FKs) are also marked. These are the "glue" that allows us to draw relationship lines.
- Relationships are visualized with lines connecting entities, and cardinality (e.g., 1:1, 1:M, M:N) is shown using a notation like Crow's Foot.
- Many-to-many (M:N) relationships are resolved using a composite (or junction) entity.
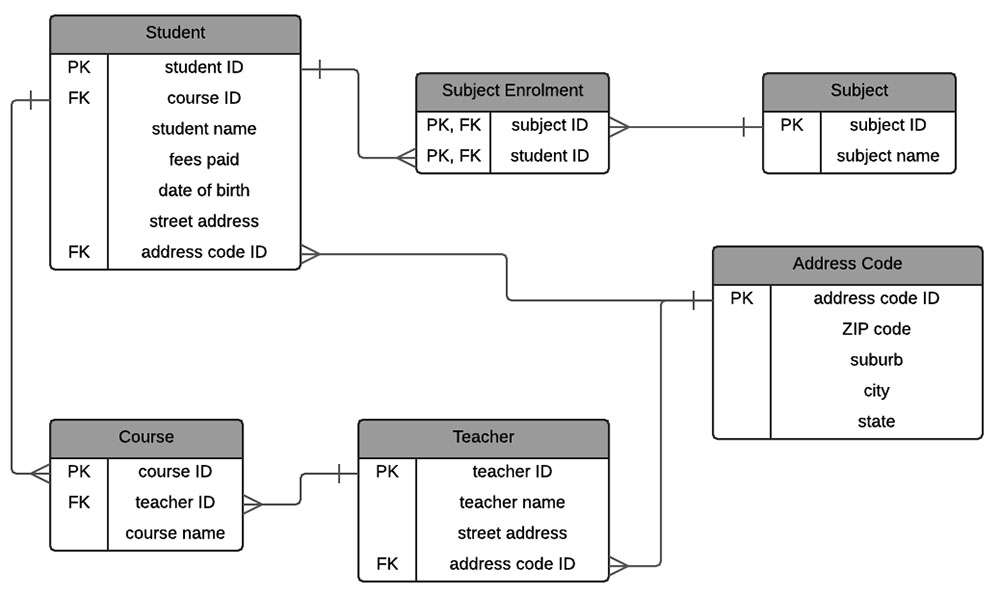
The image below is an excellent example of a final ERD for a normalized database. Notice how each entity corresponds to a table, attributes are listed, keys are marked (PK/FK), and the Crow's Foot notation clearly shows the one-to-many relationships. The Subject Enrolment entity is a composite entity resolving the M:N relationship between Student and Subject.
2. The Step-by-Step Process of Drawing the ERD
Creating an ERD from a set of 3NF tables is a systematic process of translation. You're essentially "reverse engineering" the visual design from the final table structure.
The Process:
- Draw Entities: For each table in your 3NF schema, draw a rectangle and label it with the table's name. This is your entity.
- List Attributes and Keys: Inside each entity rectangle, list all of its columns as attributes. Mark the Primary Key (PK) and any Foreign Keys (FK).
- Draw Relationships based on Foreign Keys: This is the most important step. For every Foreign Key you've identified, you will draw a relationship line.
- If
Table Bcontains a Foreign Key that references the Primary Key ofTable A, draw a line connecting theAandBentities.
- If
- Determine and Mark Cardinality: Once a relationship line is drawn, you must define its cardinality.
- One-to-Many (1:M): This is the most common case. In the scenario from step 3, the relationship is one-to-many from
AtoB. The "one" side is by the parent entity (A) and the "many" side (the Crow's Foot) is by the entity containing the Foreign Key (B). Why? Because one record inAcan be related to many records inB, but each record inBcan only relate back to one record inA. - Resolving Many-to-Many (M:N): You've already done the hard work here during normalization. A composite entity (or junction table) is used to break down an M:N relationship into two 1:M relationships. You will identify this when you see a table whose Primary Key is composed entirely of Foreign Keys from two other tables.
- One-to-Many (1:M): This is the most common case. In the scenario from step 3, the relationship is one-to-many from
The following article from Miro provides an excellent walkthrough of creating an ERD. Pay special attention to the section on refining and validating the diagram, as it explicitly discusses the role of normalization.
How to Draw an ER Diagram: A Step-by-Step Guide
This reading explains how to refine a diagram by checking it against normalization rules.
Please read the sections: Step 5: Refine and validate your diagram: Focus on the Normalization check subsection. It explains how to ensure your ERD structure respects 1NF, 2NF, and 3NF. This directly links our previous lessons on normalization to the visual ERD. Common mistakes to avoid when drawing ERDs: Read the subsection on Inadequate normalization. This reinforces why the steps you learned are so important for creating a good design.
3. Practical Example: From Tables to ERD
Let's apply this process to the PROJECT_ASSIGNMENT example from our last lesson. After normalization to 3NF, we had the following three tables:
PROJECTProjID(PK)ProjName
EMPLOYEEEmpID(PK)EmpNameEmpDept
ASSIGNMENTProjID(FK, PK)EmpID(FK, PK)HoursWorked
Now, let's draw the ERD:
- Draw Entities: Create three rectangles for
PROJECT,EMPLOYEE, andASSIGNMENT. - List Attributes and Keys: Populate each entity with its attributes and mark the keys as defined above.
- Draw Relationships:
- The
ASSIGNMENTentity has a Foreign KeyProjIDthat points toPROJECT. Draw a line betweenPROJECTandASSIGNMENT. - The
ASSIGNMENTentity has a Foreign KeyEmpIDthat points toEMPLOYEE. Draw a line betweenEMPLOYEEandASSIGNMENT.
- The
- Determine Cardinality:
- For the
PROJECT-ASSIGNMENTlink: The FK is inASSIGNMENT. So, the "many" side is atASSIGNMENT, and the "one" side is atPROJECT. This is a1:Mrelationship. - For the
EMPLOYEE-ASSIGNMENTlink: The FK is inASSIGNMENT. So, the "many" side is atASSIGNMENT, and the "one" side is atEMPLOYEE. This is another1:Mrelationship.
- For the
The final ERD shows that the ASSIGNMENT entity is a composite entity that correctly resolves the many-to-many relationship between PROJECT and EMPLOYEE.
4. A Comprehensive Walkthrough
The process of designing a database often flows from initial requirements analysis directly to a normalized ERD. The following video provides an excellent end-to-end demonstration of this workflow for a "Twitter-like" application. Watching it will help you see how all the concepts you've learned fit together in a real-world scenario.
From Idea to Production-Ready Database Design (No More Mistakes!)
This video demonstrates the entire process of database design, from idea to a complete, normalized ERD.
As you watch, focus on how the presenter translates business rules into a database structure: Identifying Entities (watch this part): Notice how nouns in the project description become the initial entities. Creating Tables and PKs (watch this part): Every table gets a non-business primary key (like an ID), which is a best practice. One-to-Many Relationships (watch this part): See how adding a foreign key to one table creates a 1:M relationship. For example, userId is added to the tweets table. One-to-One Relationships (watch this part): A user can have only one subscription. Many-to-Many Relationships (watch this part): Pay close attention to how a separate follows table is created to handle the M:N relationship between users. This is a composite entity in action. The Final ERD (watch this part): The video concludes with a review of the complete ERD, which naturally arrives at a normalized state by following these design principles.
5. Final Practice Exercise
You've learned the theory and seen it in action. Now it's time to create a complete ERD yourself. This exercise is the culmination of the entire course.
Scenario:
You have normalized a database for a university registration system into the following 3NF tables:
STUDENTStudentID(PK)StudentNameMajor
PROFESSORProfessorID(PK)ProfNameDepartment
COURSECourseID(PK)CourseNameCreditsProfessorID(FK)
ENROLLMENTStudentID(FK, PK)CourseID(FK, PK)Grade
Your Task:
Draw a complete ERD that represents this 3NF schema. Make sure to:
- Draw all entities and their attributes.
- Clearly mark all Primary Keys (PK) and Foreign Keys (FK).
- Use Crow's Foot notation to show the correct cardinality for all relationships.
Take your time to draw this out on paper or using any simple drawing tool. Then, compare your result with the solution below.
Click to see the solution
ERD Description:
Your diagram should have four entities: STUDENT, PROFESSOR, COURSE, and ENROLLMENT.
-
PROFESSORtoCOURSErelationship:- The
COURSEtable containsProfessorIDas a Foreign Key referencingPROFESSOR. - This indicates a one-to-many (1:M) relationship. One professor can teach many courses, but each course is taught by only one professor.
- The line should have a "one" marker near
PROFESSORand a "many" (Crow's Foot) marker nearCOURSE.
- The
-
STUDENTandCOURSEtoENROLLMENTrelationships:- The
ENROLLMENTentity's primary key is{StudentID, CourseID}, which are both foreign keys from theSTUDENTandCOURSEtables respectively. - This structure identifies
ENROLLMENTas a composite entity resolving a many-to-many (M:N) relationship betweenSTUDENTandCOURSE. - There should be a one-to-many (1:M) relationship from
STUDENTtoENROLLMENT. (One student can enroll in many courses). - There should be a one-to-many (1:M) relationship from
COURSEtoENROLLMENT. (One course can have many students enrolled).
- The
Your final drawing should look conceptually similar to the student enrollment diagram shown at the beginning of this lesson, with ENROLLMENT acting as the central junction table.
Conclusion
Congratulations on completing your course on database design! You have successfully bridged the gap from abstract business requirements to a concrete, optimized database blueprint.
Key Takeaways from this lesson:
- A 3NF ERD is the definitive visual guide to a well-designed relational database.
- The process of creating an ERD from normalized tables is a systematic translation: tables become entities, columns become attributes, and foreign keys define the relationships and their cardinalities.
- Composite entities are the visual solution for M:N relationships, breaking them into two manageable 1:M relationships.
You now possess the core skills to design a robust database schema for a given scenario, from identifying entities and relationships to performing normalization and producing a final, professional ERD. This foundation is crucial for any work involving data management and application development. The logical next step, which is outside the scope of this course, would be to translate this ERD into a physical model and write the SQL CREATE TABLE statements to build the actual database.