Hello! Welcome to the fifth and final lesson of our first module, "The Data Scientist's Python Toolkit."
Introduction
In our previous lessons, we've built a solid foundation by mastering NumPy, Pandas, Matplotlib, and, most recently, the core API of Scikit-learn. You've learned how these tools work in isolation. Now, it's time to bring them all together.
This lesson is our first capstone project. We will take on the classic Titanic survival prediction problem, applying everything we've learned to a real-world dataset. Our goal is not yet to build a predictive model, but to perform the crucial preliminary steps that every data scientist must master:
- Loading the data into a workable format.
- Inspecting it to understand its structure and content.
- Cleaning it by handling missing values and irrelevant information.
- Visualizing it to uncover patterns and relationships.
This process, known as Exploratory Data Analysis (EDA), is the heart of data science. The insights we gather here are what inform the modeling choices we'll make later in the course. By the end of this lesson, you will have a clean, prepared dataset, ready for the machine learning algorithms we will study in future modules.
Let's look at the kind of analysis we'll be able to produce.

1. Setting the Stage: The Project Workflow
Our project is to predict survival on the Titanic. Given a passenger's data (like age, class, and sex), can we determine if they were likely to survive the disaster? This is a classic binary classification problem.
Before we write any code, it's essential to have a clear workflow in mind. Let's start by watching a brief overview of the project and importing the libraries we'll need.
Project 15. Titanic Survival Prediction using Machine Learning in Python | Machine Learning Project
This video by Siddhardhan will guide our project. The first part introduces the problem statement and the data science workflow we will follow. The second part covers importing the essential Python libraries.
Watch from the beginning to 08:58. The first segment (until 03:52) outlines the six steps of a typical machine learning project. The second segment (from 05:47 to 08:58) demonstrates importing NumPy, Pandas, Matplotlib, Seaborn, and key functions from Scikit-learn. Pay attention to the role of each library.
As you saw, the standard workflow involves collecting data, processing it, performing analysis, and then training and evaluating a model. This lesson focuses on the first three steps: data collection, processing, and analysis.
2. Loading and Initial Inspection
With our libraries imported, the first practical step is to load the data and get a feel for its structure. We'll load a .csv file into a Pandas DataFrame and use some fundamental DataFrame methods to inspect it.
Project 15. Titanic Survival Prediction using Machine Learning in Python | Machine Learning Project
Let's load the Titanic dataset and perform our first inspection to understand its contents.
Watch from 08:58 to 18:52. This section covers several key initial steps: Loading the train.csv file into a Pandas DataFrame using pd.read_csv(). Using .head() to view the first 5 rows and understand the columns. Using .shape to check the dataset's dimensions (number of rows and columns). Using .info() to get a summary of data types and identify columns with missing values.
From this initial inspection, we can draw a few key conclusions:
- The dataset contains 891 entries (passengers) and 12 columns (features).
- The
Age,Cabin, andEmbarkedcolumns have missing values. - We have a mix of data types: numerical (
Age,Fare), categorical (Sex,Embarked), and text (Name).
3. Data Cleaning: Preparing the Data for Analysis
Raw data is rarely perfect. Our next task is to "clean" it by addressing missing values and converting non-numerical data into a format that a machine learning model can understand.
Handling Missing Values
We have three columns with missing data. We need a strategy for each.
- Cabin: This column is missing a very large percentage of its values (687 out of 891). Trying to "guess" or impute these values would likely introduce more noise than signal. The best strategy here is to drop the column entirely.
- Age: This column is missing a significant but manageable number of values (177). Since age is a continuous numerical feature, a common strategy is to replace the missing values with the central tendency of the existing values, such as the mean or median.
- Embarked: This column is only missing two values. As it's a categorical feature, we can replace the missing entries with the most common port of embarkation (the mode).
Let's see how to implement these strategies in code.
Project 15. Titanic Survival Prediction using Machine Learning in Python | Machine Learning Project
Our initial inspection revealed missing data in three columns. Let's watch how to handle each case systematically.
Watch from 18:52 to 30:03. This is a crucial section that demonstrates: Using .isnull().sum() to count missing values per column. Dropping the 'Cabin' column using .drop(). Imputing missing 'Age' values with the column's mean using .fillna(). Filling the two missing 'Embarked' values with the mode. Verifying that all missing values have been successfully handled.
Encoding Categorical Features
Machine learning models are mathematical, which means they work with numbers, not text labels like 'male' or 'female'. We need to convert our categorical text data into a numerical representation. This process is called encoding.
For this project, we'll use a simple mapping:
Sex: 'male' -> 0, 'female' -> 1Embarked: 'S' -> 0, 'C' -> 1, 'Q' -> 2
Project 15. Titanic Survival Prediction using Machine Learning in Python | Machine Learning Project
Let's see how to convert the 'Sex' and 'Embarked' columns from text to numbers using the Pandas .replace() method.
Watch from 41:14 to 46:49. Focus on the syntax for replacing text values with numerical ones for the 'Sex' and 'Embarked' columns.
4. Visualization and Exploratory Analysis
Now that our data is clean, we can start the most exciting part of EDA: asking questions and searching for answers through visualization. Good visualizations can reveal patterns that aren't obvious from looking at raw numbers.
We'll follow a structured approach, first looking at variables one by one (univariate analysis) and then exploring relationships between them (multivariate analysis). For a formal overview of this process, the following reading is helpful.
Exploratory Data Analysis and Cleaning with Titanic
This article from 4Geeks provides a structured guide to analyzing variables, distinguishing between univariate and multivariate analysis.
Read 'Step 3: Analysis of univariate variables'. This section explains how to use histograms and box plots to analyze categorical and numerical variables individually.
With that framework in mind, let's apply these ideas to our dataset and create visualizations to uncover key patterns.
Project 15. Titanic Survival Prediction using Machine Learning in Python | Machine Learning Project
Let's use Seaborn to visualize our clean data and look for insights related to survival.
Watch from 30:03 to 41:14. This part of the video shows you how to: Use .describe() for a statistical summary of numerical data. Use .value_counts() to count survivors and non-survivors. Create countplots to visualize distributions of Survived, Sex, and Pclass. Use the hue parameter to perform multivariate analysis, comparing survival rates across different genders and passenger classes.
The video's visualizations likely revealed two powerful insights:
- Women were far more likely to survive than men.
- Passengers in first class had a much higher survival rate than those in third class.
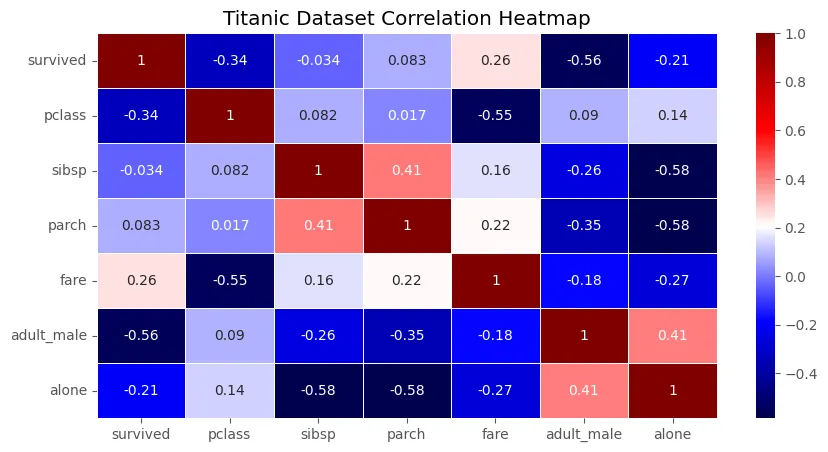
Another powerful tool for exploring relationships is a correlation heatmap, which visualizes the linear relationships between all numerical features.
5. Final Preparation: Separating Features and Target
The final step in preparing our data is to separate the columns we will use to make predictions (the features) from the column we are trying to predict (the target).
- Features (X): All the columns we want to use as input to our model. We will also drop columns that are not useful for prediction, such as
PassengerId,Name, andTicket. - Target (y): The
Survivedcolumn, which is the output our model will try to predict.
Project 15. Titanic Survival Prediction using Machine Learning in Python | Machine Learning Project
Let's perform the final step of data preparation: creating our X (features) and y (target) DataFrames.
Watch from 46:49 to 50:45. This segment shows how to create the feature matrix X by dropping the 'Survived' column and other irrelevant columns, and how to create the target vector y by selecting the 'Survived' column.
At this point, our dataset is fully loaded, inspected, cleaned, and prepared. The next logical step in a full project would be to split this data into training and testing sets using Scikit-learn's train_test_split, which you learned about in the previous lesson. However, our goal for this lesson was preparation, and we have achieved it.
Conclusion
Congratulations on completing your first data science project! You have successfully navigated the entire Exploratory Data Analysis workflow, transforming a raw dataset into a clean, well-understood, and model-ready format.
Key Takeaways:
- EDA Workflow: A structured process of loading, inspecting, cleaning, and visualizing data is fundamental to any data science project.
- Data Cleaning: We addressed real-world data imperfections by handling missing values (dropping or imputing) and encoding categorical variables.
- Insight through Visualization: We used
countplotand heatmaps to move beyond raw numbers and uncover significant patterns, such as the relationship between sex, class, and survival. - Preparation for Modeling: The final dataset is separated into a feature matrix
Xand a target vectory, the standard input format for Scikit-learn models.
This lesson marks the end of our first module. You are now equipped with the essential Python toolkit for any data scientist.
Preview of the Next Module:
Now that we know how to prepare data, we will turn our attention to the models themselves. In the next module, "Probability Models for Data," we will dive into the mathematical foundations of data science, starting with the probability distributions that are used to model real-world phenomena.