Hello! Let's continue our journey into the dimension of Time.
In the last lesson, we established the importance of the Asian session. You learned to identify the Asian Range (7:00 PM to midnight New York time) and understood its primary role: to consolidate and build pools of buy-side and sell-side liquidity. This quiet accumulation phase sets the stage for the more volatile sessions that follow.
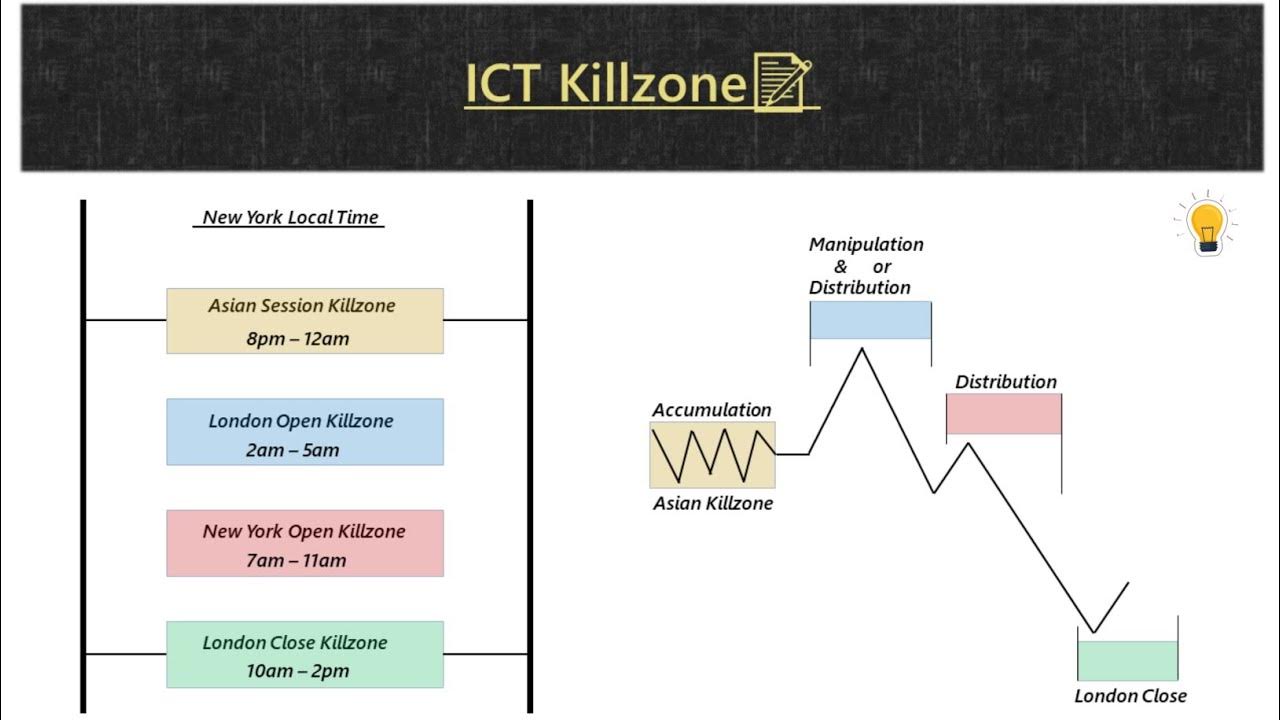
Today, we transition from accumulation to manipulation. This lesson focuses on the first major window of opportunity where this built-up liquidity is often targeted. We will address the learning outcome: Define the London Killzone and its optimal trading window. You will learn the exact time to be at your charts to witness and potentially capitalize on one of the most significant moves of the trading day.
1. The London Killzone: Definition and Time
The London Killzone is the first of the major daily killzones. It coincides with the opening of the London financial center, which injects enormous volume and volatility into the market. This is when institutional algorithms often make their move to engineer liquidity.
The ICT definition is precise and must be adhered to.
ICT London Killzone:
- Time Window: 2:00 AM to 5:00 AM New York local time.
It is absolutely critical that your charts are set to the New York timezone (UTC-4 or UTC-5, depending on Daylight Saving) to correctly identify this window. All ICT time-based concepts are anchored to this specific timezone.
For a formal definition and a breakdown of its core characteristics, please read the following text.
The document 'ICT Kill Zones' from innercircletrader.net provides a direct and authoritative definition. This will serve as our foundational understanding.
Read the section titled 'ICT London Kill Zone'. Pay close attention to the timing, the pairs most affected (EUR, GBP), and the description of how it interacts with the Asian session on bullish and bearish days.
As the text highlights, the London Killzone is significant because it often sets the high or low of the day. This happens through a specific process of liquidity engineering that we will explore next.
2. The Purpose of the London Killzone: Engineering Liquidity
The London Killzone is not just a random period of high volume; it has a purpose. Its primary function is often to conduct a manipulation of the liquidity built up during the Asian session. This is the "Judas Swing" we touched upon in the last lesson.
During this 2 AM to 5 AM window, we typically expect to see one of two scenarios play out:
- London Reversal: Price runs above the Asian Range high or below the Asian Range low, sweeping that liquidity. It then sharply reverses, creating the high or low of the day, and begins the main distributional move. This is the classic "stop hunt" pattern.
- London Continuation: Price breaks out of the Asian Range and uses the liquidity from the sweep to fuel a continuation in the same direction, often after a small retracement. This happens when the London move is aligned with a strong higher timeframe trend.
Understanding these two potential narratives is key to interpreting the price action during this window.
The following video provides an excellent explanation of these two scenarios.
How To Trade London Session (Full Trading Plan)
The video 'How To Trade London Session' from the Rize Trades channel clearly explains the concepts of London reversal and London continuation.
Watch from 01:25 to 02:44. The presenter does a great job of explaining why you shouldn't blindly assume a reversal will happen after an Asia liquidity sweep. Focus on understanding the difference between the 'London reversal' and 'London continuation' models.
Here is a chart example of a classic London Reversal.

3. Practical Application: Setting Up Your Charts
Being able to identify the London Killzone on your chart in real-time is a fundamental skill. You can do this manually with vertical lines or by using a dedicated indicator. The following video demonstrates both methods.
ICT Killzones & Indicator Settings
The video 'ICT Killzones & Indicator Settings' from TTrades provides a practical guide to getting the Killzones onto your chart.
First, watch from 01:43 to 02:04 to hear the presenter confirm the London Killzone time. Then, jump to 04:55 and watch until 07:39. This section details how to find and configure a popular TradingView indicator to automatically display the correct Killzone times and colors. Pay close attention to the timezone and session time settings to ensure accuracy.
By correctly setting up this indicator, you will have a constant visual reminder of when these high-probability windows are active, helping you focus your attention when it matters most.
4. A Walkthrough Example
Let's see how all the pieces come together. The same video from TTrades provides a great example of analyzing price action as it unfolds through the Asian, London, and New York sessions. Watching this will help solidify the concepts.
ICT Killzones & Indicator Settings
Let's continue with the TTrades video to see a complete example of price action during the London session.
Watch the section from 08:52 to 11:34. The presenter analyzes the price action as it enters the London Killzone. Notice how they identify the sweep of the Asia low, the subsequent displacement higher, and the formation of ICT arrays like Fair Value Gaps and Order Blocks that provide entry opportunities. This demonstrates how the Killzone provides the context for the setups you've already learned about.
This example demonstrates that the London Killzone is the time-based filter for applying your price-based analysis. You are not just looking for a Fair Value Gap at any time; you are looking for one that forms after a liquidity sweep within the London Killzone. This confluence of time and price is what creates high-probability ICT setups.
Conclusion
You have now defined the second key time block of the trading day. You've moved beyond the passive accumulation of the Asian Range and into the active manipulation phase of the London Killzone. This is where the day's narrative often begins.
Key Takeaways:
- The ICT London Killzone is the three-hour window from 2:00 AM to 5:00 AM New York time.
- It is a period of high volume and volatility, ideal for finding trade setups.
- Its primary function is often to manipulate the liquidity created during the Asian session.
- The two primary scenarios to anticipate are the London Reversal (Judas Swing) and the London Continuation.
- This killzone acts as a time filter, telling you when to look for the high-probability price patterns you have learned.
Preview of the Next Lesson:
The story of the trading day doesn't end with London. As the London session progresses and financial centers in North America open, a new wave of liquidity and volatility enters the market. In our next lesson, we will define the New York Killzone and its optimal trading window, and see how it can either continue the move started in London or offer its own unique reversal opportunities.