Hello! Welcome to the sixth lesson in our final module on trade management and professional development.
In our last lesson, you learned how to systematically backtest an ICT trading model. You now have a process to go through historical charts, identify setups according to your rules, and log every trade outcome in a journal. The result of that hard work is a raw dataset of your strategy's performance.
Today, we will focus on what to do with that data. Our learning outcome is to analyze backtesting results to calculate win rate and risk-reward metrics. This is where you transform your trade log from a simple record into a powerful analytical tool that tells you whether you have a true statistical edge.
For someone with your background in marketing, this process is directly analogous to analyzing a campaign's Key Performance Indicators (KPIs). A high click-through rate (like a high win rate) is nice, but it's meaningless without knowing the conversion rate and return on investment (ROI). In trading, Win Rate and Risk-Reward are your primary KPIs, and understanding them is crucial for building a profitable business.
1. The Two Pillars of Performance: Win Rate and Risk-Reward
A trading strategy's profitability rests on two fundamental pillars: how often it wins (Win Rate) and how much it wins relative to how much it loses (Risk-Reward Ratio). Evaluating either metric in isolation can be dangerously misleading.
Let's start by formally defining these terms.
The 5 KPIs That Matter Most in Backtesting a Strategy
The article 'The 5 KPIs That Matter Most in Backtesting a Strategy' from FX Replay provides clear, concise definitions for our core metrics. It frames them as KPIs, which should feel familiar.
Please read the sections titled '1. Win Rate (%) – The First Illusion' and '2. Reward-to-Risk Ratio (R:R) – The Real Profit Engine'. Pay close attention to the formulas and the examples of why a high win rate isn't always good and a low win rate isn't always bad.
As the article explains:
- Win Rate: The percentage of trades that are profitable.
- Risk-Reward Ratio (R:R): The ratio of your average profit on winning trades to your average loss on losing trades.
A strategy with a 90% win rate sounds amazing, but if your average win is $10 and your average loss is $100, one loss will wipe out nine wins, leaving you with a net loss. Conversely, a strategy with a 40% win rate can be highly profitable if your average win is $300 and your average loss is $100 (a 3:1 R:R).
2. The Critical Interplay
The key to a profitable strategy is finding a positive balance between your win rate and your risk-reward ratio. You don't necessarily need a high win rate if your R:R is strong.
This concept is so fundamental that it's worth seeing it explained in a few ways.
Risk to Reward Ratio: The #1 Trading Secret Beginners Must Know (Step-by-Step Guide)
The video 'Risk to Reward Ratio: The #1 Trading Secret' from the Chart Champions channel does an excellent job of illustrating this crucial balance.
Watch the section from 03:34 to 05:25. The presenter shows a clear graphic illustrating how a higher R:R ratio allows you to be profitable with a much lower win rate.
The relationship can be visualized as a matrix. For any given R:R, there is a specific win rate you must exceed to be profitable.
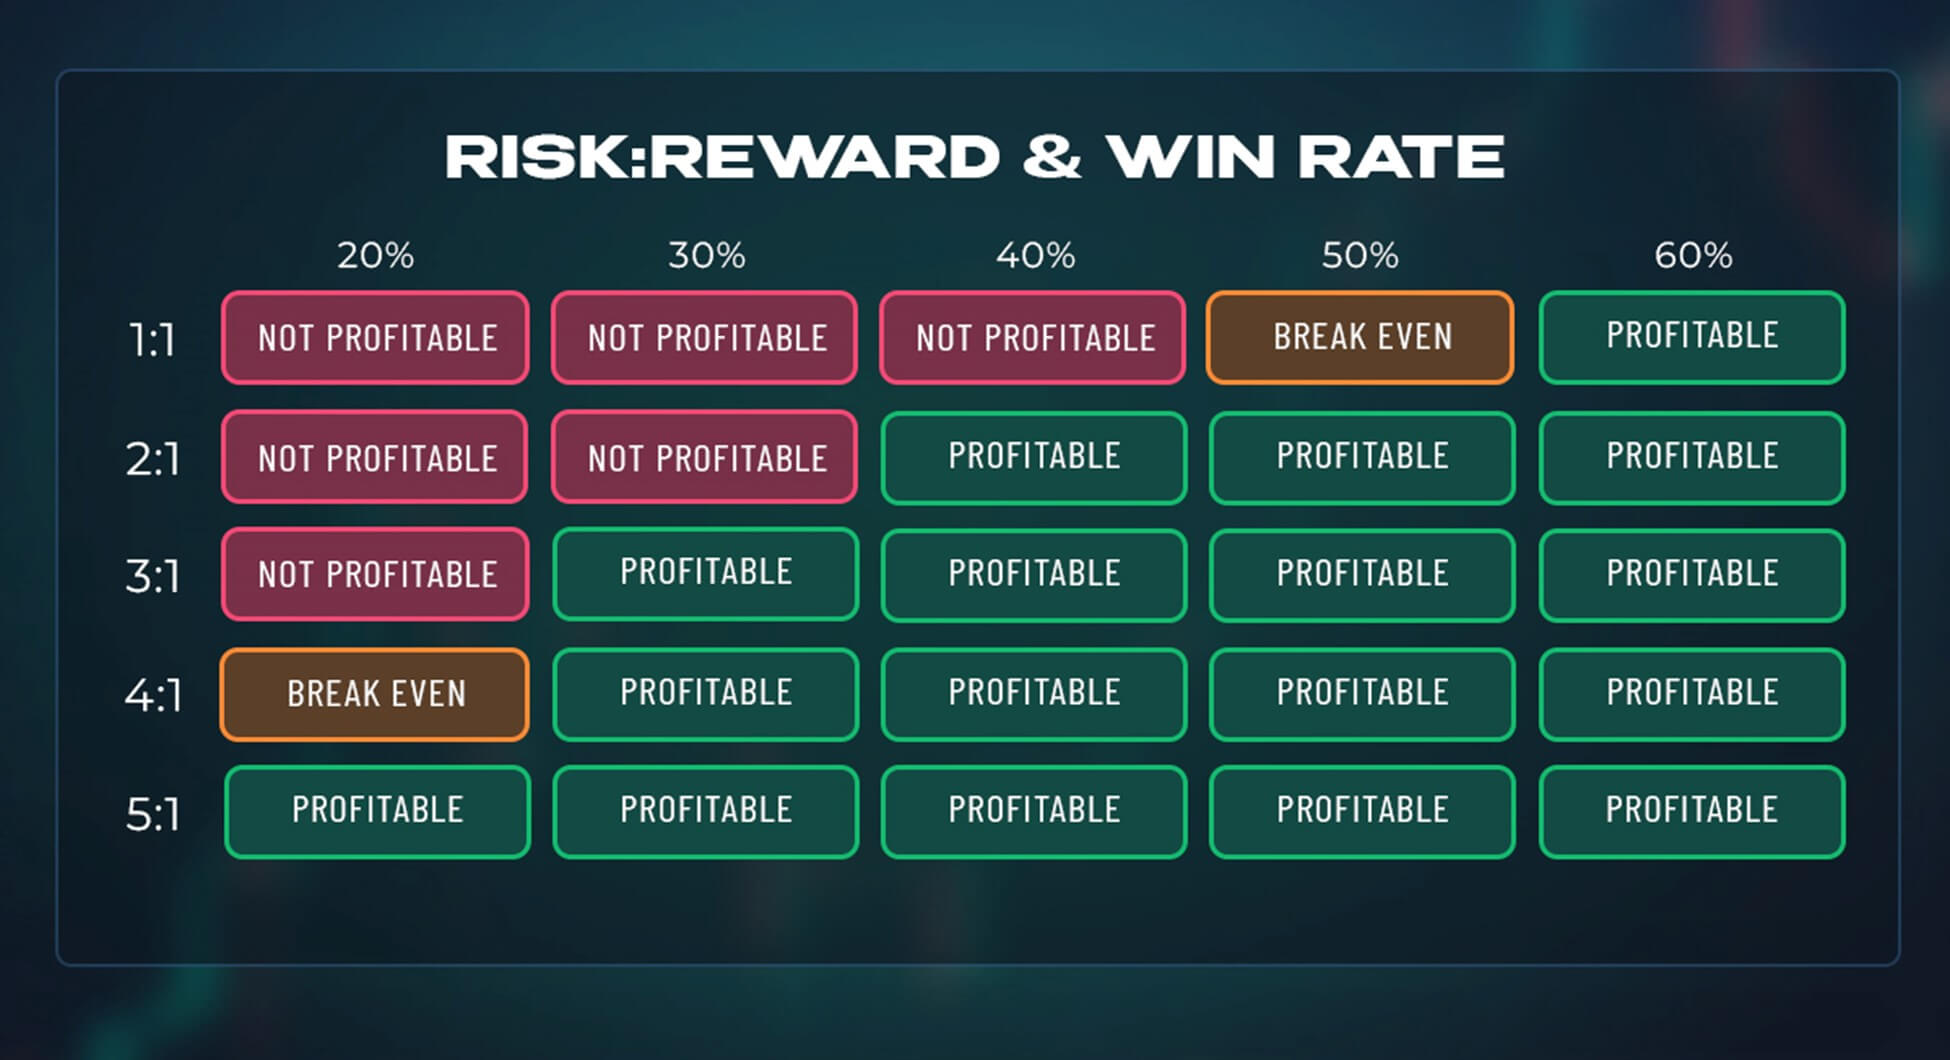
A practical way to think about this is by calculating your Break-Even Win Rate: the minimum win rate required for your strategy to not lose money.
For example, if your strategy consistently targets a 2R profit:
- Your R:R Ratio is 2.
- Break-Even Win Rate = 1 / (1 + 2) = 1/3 or 33.3%.
This means if you win more than one-third of your trades, your strategy is profitable. Any win rate below this, and you will lose money over time.

3. Calculating Your Metrics: From Raw Data to Actionable KPIs
Now, let's get practical. You have your backtesting log in a spreadsheet. How do you efficiently calculate these KPIs? Manually counting wins and losses and averaging them is slow and prone to error. A better way is to use spreadsheet formulas to do the work for you.
The following video provides an excellent, step-by-step guide to setting up a spreadsheet to automatically analyze your backtesting results.
Forex trading - How to use a spreadsheet for backtesting ( backtesting results and live trading )
In 'Forex trading - How to use a spreadsheet for backtesting,' Steven from The Trading Channel demonstrates exactly how to use common spreadsheet functions to calculate your performance metrics.
Watch from 05:43 to 18:02. The first part (until 09:33) shows a completed analysis, which is great for context. The second, more important part (from 09:33 onwards) is a tutorial where he builds the formulas from scratch. Focus on understanding these key functions: SUM to get total profit/loss. AVERAGEIF to calculate average win and average loss. COUNTIF to count the number of winning and losing trades. How he combines these to calculate Win Rate and R:R.
Your KPI Calculation Cheatsheet
Here are the key formulas from the video that you will use to analyze your trade log. Assume your trade results (in R-multiples, e.g., +2R, -1R) are in a column, let's say D2:D101.
- Total Trades:
=COUNT(D2:D101) - Winning Trades:
=COUNTIF(D2:D101, ">0") - Losing Trades:
=COUNTIF(D2:D101, "<0") - Win Rate (%):
= (Winning Trades cell) / (Total Trades cell)(Format this cell as a percentage). - Gross Profit (Total R won):
=SUMIF(D2:D101, ">0") - Gross Loss (Total R lost):
=SUMIF(D2:D101, "<0")(This will be a negative number). - Average Win:
=AVERAGEIF(D2:D101, ">0") - Average Loss:
=AVERAGEIF(D2:D101, "<0") - Risk-Reward Ratio:
=ABS((Average Win cell) / (Average Loss cell))
By setting this up once, you can simply paste new trade data into your log, and your KPIs will update automatically, giving you instant feedback on your performance.
4. Beyond the Basics: Expectancy and Profit Factor
Win Rate and R:R are your foundational metrics. Once you have them, you can calculate even more powerful KPIs that give you a single-number summary of your strategy's edge.
The 5 KPIs That Matter Most in Backtesting a Strategy
Let's return to the FX Replay article to learn about two advanced metrics: Expectancy and Profit Factor.
Read the sections '4. Expectancy (EV) – Your Edge, Quantified' and '5. Profit Factor (PF) – The Risk-Adjusted Bottom Line'. These metrics combine your Win Rate and R:R into a single, powerful number.
-
Expectancy (or Expected Value, EV): This is the most important metric in professional trading. It tells you what you can expect to make or lose on average for every single trade you take.
If your Expectancy is positive, you have a statistical edge. If it's negative, the casino (market) has an edge on you. -
Profit Factor: This measures how many dollars you make for every dollar you lose. It's a measure of efficiency.
A profit factor below 1 means you are losing money. A value above 1.5 is considered decent, and above 2.0 is very strong.
Calculating these two metrics from your backtesting data will tell you definitively if the ICT model you tested has a positive edge that is worth trading with real money.
Conclusion
You have now moved from being a data collector to a data analyst. You understand that a strategy's performance is not about a single metric but about the delicate and crucial balance between how often you win and how much you win.
Key Takeaways:
- Win Rate and Risk-Reward Ratio are the core KPIs for any trading strategy.
- Neither metric is useful in isolation. A low win rate can be profitable with a high R:R, and a high win rate can be unprofitable with a poor R:R.
- You can use standard spreadsheet formulas (
COUNTIF,AVERAGEIF,SUMIF) to automatically calculate these KPIs from your backtesting journal. - Expectancy is the ultimate measure of your edge, telling you the average profit or loss per trade. A positive expectancy is the statistical proof of a viable strategy.
- Profit Factor measures the efficiency of your strategy in generating profits over losses.
Preview of the Next Lesson:
Now that you can systematically test an ICT model and quantitatively analyze its performance, you have the tools to compare different strategies. In our next lesson, "Develop a personalized trading plan integrating your selected ICT models," we will use this analytical ability to help you choose the models that best suit your style and combine them into a formal, written trading plan—the business plan for your trading career.