Hello! Welcome back to the final module of our course, "Trade Management and Professional Development."
In our last two lessons, we established the one-two punch of professional trade management: taking partial profits to "pay yourself" and moving your stop to break-even to "protect yourself." These are rule-based actions you take during a trade. But how do you refine these rules? How do you know if your entries are effective? How do you track your progress and turn experience into expertise?
The answer lies in today's topic, which is arguably the single most important habit of any successful trader. This lesson will teach you how to create a detailed trading journal entry with ICT-specific annotations.
Think of your trading journal not as a simple diary, but as a professional performance database. Given your background in marketing, you're familiar with tracking campaign metrics to analyze performance and optimize strategy. A trading journal serves the exact same purpose. It's the tool that bridges the gap between theory and consistent profitability by creating a feedback loop for continuous improvement.
1. The Why: Journaling as the Core of ICT Mastery
Before we dive into the "how," it's crucial to understand "why" journaling is a non-negotiable cornerstone of the ICT methodology. Michael, the creator of ICT, is unequivocal about this. All of his successful students have one thing in common: they are diligent journal-keepers.
Let's hear it directly from him.
ICT Mentorship 2023 - Proper Learning & The Importance Of Journaling
In this video, 'Proper Learning & The Importance Of Journaling,' ICT explains why this practice is the very thing that separates struggling students from consistent ones. He also demonstrates his personal method of annotating charts, which is a form of journaling in itself.
This is a detailed video, so we'll watch it in two parts. First, watch from the beginning to 17:10. Focus on these key ideas: The 'Secret Recipe' (00:00 - 09:08): Listen to his emphasis on how journaling, or 'backtesting' as he calls this study method, is the only way to build a deep, intuitive understanding of price action. It's not about watching more videos; it's about doing this work yourself. The Annotation Process (09:08 - 17:10): Observe how he starts on a high timeframe (monthly chart) and identifies key PD Arrays like Fair Value Gaps and Breaker Blocks. Pay attention to how he suggests using positive, self-affirming language in your notes ('you saw it coming'), which helps condition your mind to recognize patterns.
As ICT explains, journaling isn't just a record of wins and losses. It is the practice itself. By meticulously annotating charts, you are:
- Training your eye to see the ICT concepts in real price action.
- Building a narrative for why price moves from one level to another.
- Shortening your learning curve by creating a library of personal case studies.
- Developing a "romance with price action," as he puts it, turning a complex process into an intimate and understandable one.
2. The Anatomy of a Professional ICT Journal Entry
A proper journal entry consists of two main parts: the annotated chart and the data log. The chart tells the story, and the data log provides the quantifiable metrics for analysis.
Let's first break down what information a comprehensive entry must contain.
ICT Trading Strategy: The Complete Guide to Inner Circle Trader ...
This article, 'ICT Trading Strategy: The Complete Guide,' includes a concise section on what to include in a trading journal.
Please read the subsection titled 'Maintain a Trading Journal'. It gives a clear, bulleted list of essential components.
Based on that reading and established best practices, every ICT journal entry should capture the following:
A. Core Trade Data:
- Date & Session: e.g., "Oct 26, 2023 - NY Killzone"
- Asset: e.g., "ES," "EURUSD"
- Direction: Long or Short
- Entry, Stop Loss, Target Prices: The specific price levels.
- Risk: Both in percentage (e.g., 1%) and monetary value (e.g., $1000).
- Outcome & P&L: Win, Loss, or Break-Even, and the final profit or loss.
B. The ICT Narrative (The "Why"):
- Higher-Timeframe (HTF) Bias: What was the daily/weekly draw on liquidity?
- ICT Model Used: 2022 Mentorship, Silver Bullet, Turtle Soup, etc.
- Confluences: A list of all the ICT concepts that aligned. This is critical for pattern recognition.
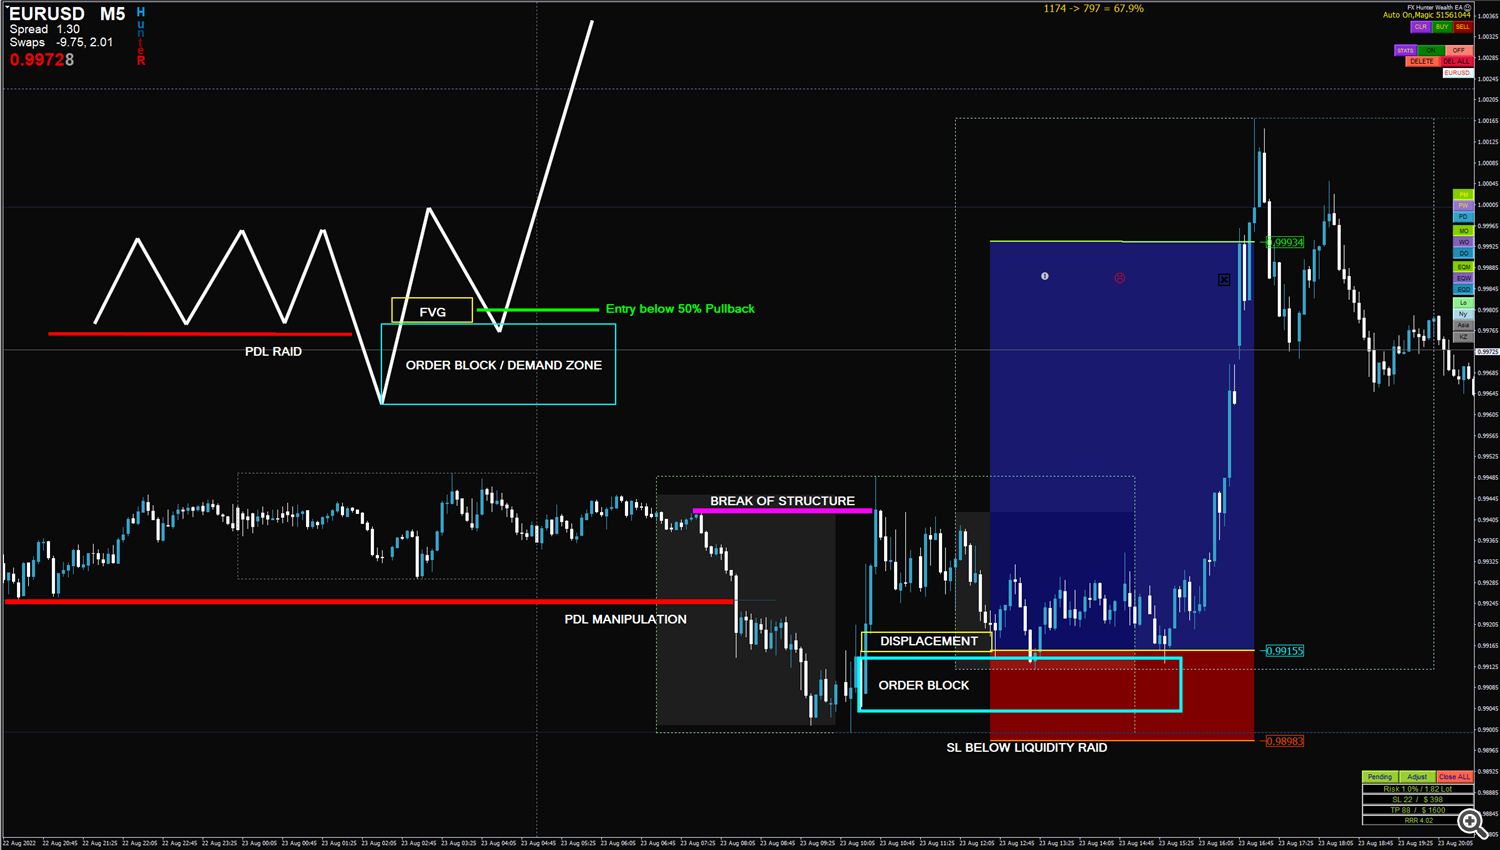
- Example: "NY AM session, Daily bias bullish. Price swept Asian session low (manipulation), followed by a 5m MSS with displacement creating an FVG inside the OTE of the daily range. Entered on the FVG retest."
- Annotated Screenshots: At least two. One showing your thesis before the trade, and one showing the outcome after.
C. Trade Management & Reflection:
- Management Actions: Note where you took partials and when you moved your stop to break-even, referencing the rules from our previous lessons.
- Psychological State: How did you feel? Were you patient? Did you follow your plan?
- Review & Lessons Learned: What went right? What could be improved?
3. The Process: Top-Down Annotation
Now let's continue with ICT's demonstration to see how this top-down analysis creates the foundation for your trade narrative. You've already seen him annotate the monthly chart. Now see how he brings that context to the lower timeframes.
ICT Mentorship 2023 - Proper Learning & The Importance Of Journaling
Let's return to the video from ICT. We will now watch how he carries the higher-timeframe analysis down through the weekly, daily, 4-hour, and 1-hour charts.
Watch from 26:24 to the end. As you watch, notice the following: Transposing Levels (26:24 - 33:18): See how he labels the PD arrays from the monthly chart on the weekly chart (e.g., 'Monthly Bearish Breaker High'). This is crucial for maintaining context. Adding Detail (33:18 - 1:10:30): On the daily and 4-hour charts, he identifies new, lower-timeframe PD arrays (like Inversion FVGs) within the context of the HTF levels. This is how you build a layered, high-probability narrative. Refining Precision (1:10:30 - End): On the hourly chart, the picture becomes even clearer, showing precise entry opportunities that are backed by the analysis from all the higher timeframes. The chart looks complex, but it's just a logical layering of information.
This process of multi-timeframe, top-down annotation is the "study" portion of your journaling. It's how you develop your daily bias and identify high-probability zones before the trading session even begins.
Here are two examples of what annotated charts for specific trade setups look like.

4. The Tool: Organizing Your Journal with Notion
Annotating charts is half the battle. The other half is logging the data in a structured way that you can easily review and analyze. While a simple spreadsheet works, a tool like Notion can be far more powerful.
This video demonstrates a fantastic, free Notion template designed specifically for ICT traders.
How I journal my trade on Notion using ICT Concepts *Free Template Included*
This video from the Richard Trading channel, 'How I journal my trade on Notion using ICT Concepts,' provides a complete walkthrough of a powerful journaling template.
Watch the entire video. The creator offers his template for free (the link is in his video's description). Pay attention to how the template allows you to: Log all the core trade data (pair, size, risk). Tag the specific ICT confluences for your setup. Rate the trade and your psychological performance. Attach your annotated screenshots directly to the entry. Automatically sort trades into 'Winners' and 'Lessons' (losers) for easy review.
This template is an excellent starting point. It transforms your journal from a simple logbook into an interactive database for performance review, perfectly aligning with the analytical mindset you've developed in your business career.
Conclusion
Today, we've outlined the complete process for creating a professional-grade trading journal tailored to the ICT methodology. This is not busywork; it is the work. It's how you will find your edge, build confidence, and turn your knowledge into a consistent, repeatable skill.
Key Takeaways:
- Journaling is Essential: As taught by ICT, it's the primary tool for developing consistency and deep market understanding.
- Two Parts, One Process: A journal entry consists of annotated charts (the narrative) and a data log (the metrics).
- Top-Down Annotation: Always start your analysis on higher timeframes (Monthly, Weekly, Daily) to establish bias and context before drilling down to find setups.
- Log Everything: Capture not only the trade data but also your psychological state and the specific ICT confluences that prompted the trade.
- Use Modern Tools: Leverage tools like Notion to create a powerful, analyzable database of your trades.
Preview of the Next Lesson:
Your new journal will be the home for all the data you collect in our next lesson: "Define and execute a systematic backtesting process for ICT setups." We will take the journaling process you've learned today and apply it systematically to historical data, allowing you to test ICT models and build statistical confidence in your trading plan before risking real capital.