Hello! Welcome to the fifth and final lesson of our first module on the foundations of computation.
Introduction
In our last few lessons, we've established a solid foundation for describing DFAs. We've used the formal 5-tuple definition for mathematical precision and state diagrams for visual intuition. We also learned how to trace a DFA's computation to see how it processes strings.
Today, we'll introduce a third, equally important representation: the transition table. This lesson focuses on a key practical skill: constructing a transition table from a DFA's state diagram and vice versa.
Mastering this skill is crucial because it bridges the gap between the intuitive visual design of a DFA and a structured format that is ready for computer implementation.
From Visuals to Tables
A state diagram is excellent for brainstorming and understanding the flow of a machine. However, to implement a DFA in software, a more structured format is needed. The transition table provides exactly that. It's a direct, tabular representation of the transition function, .
A transition table has a standard structure:
- The rows correspond to the states in .
- The columns correspond to the input symbols in the alphabet .
- Each cell at the intersection of a state (row) and a symbol (column) contains the next state.
- Special markers are used to indicate the start state (often an arrow
->) and final states (often an asterisk*or by circling the state name).
The following video provides a clear walkthrough of how to represent a finite automaton using both a diagram and a table, and how to derive one from the other.
Representation of Finite Automata || Transition Diagram || Transition Table || TOC || FLAT
This video by Sudhakar Atchala explains the two main representations of a finite automaton and demonstrates how to create the formal definition and the transition table from a state diagram.
Please watch from 01:52 to 07:35. The first part (01:52 - 06:00) shows how to extract the 5-tuple components from a state diagram. The key part for our lesson is the second segment (06:00 - 07:35), which demonstrates how to construct the corresponding transition table from that same diagram.
As you saw in the video, every piece of information in the state diagram—states, symbols, and transitions—has a corresponding place in the transition table.
Let's look at another example to solidify this. The resource below shows a DFA that recognizes strings with an odd number of 0s, presented as both a diagram and a table.
This document provides a concise example of a DFA formalized as a 5-tuple, along with its transition table.
Please review page 27 of the PDF. You can find it by looking for the heading 'DFA: Deterministic Finite Automata (2.4)'. Observe how the state diagram on the left is systematically converted into the transition table on the right.
Notice the direct correspondence: the arc labeled '0' from state to state in the diagram corresponds to the entry in the table at the row for and the column for '0', which contains .
Your Turn: From Diagram to Table
Now, let's practice this conversion. Below is a state diagram for a DFA. Your task is to construct its corresponding transition table.
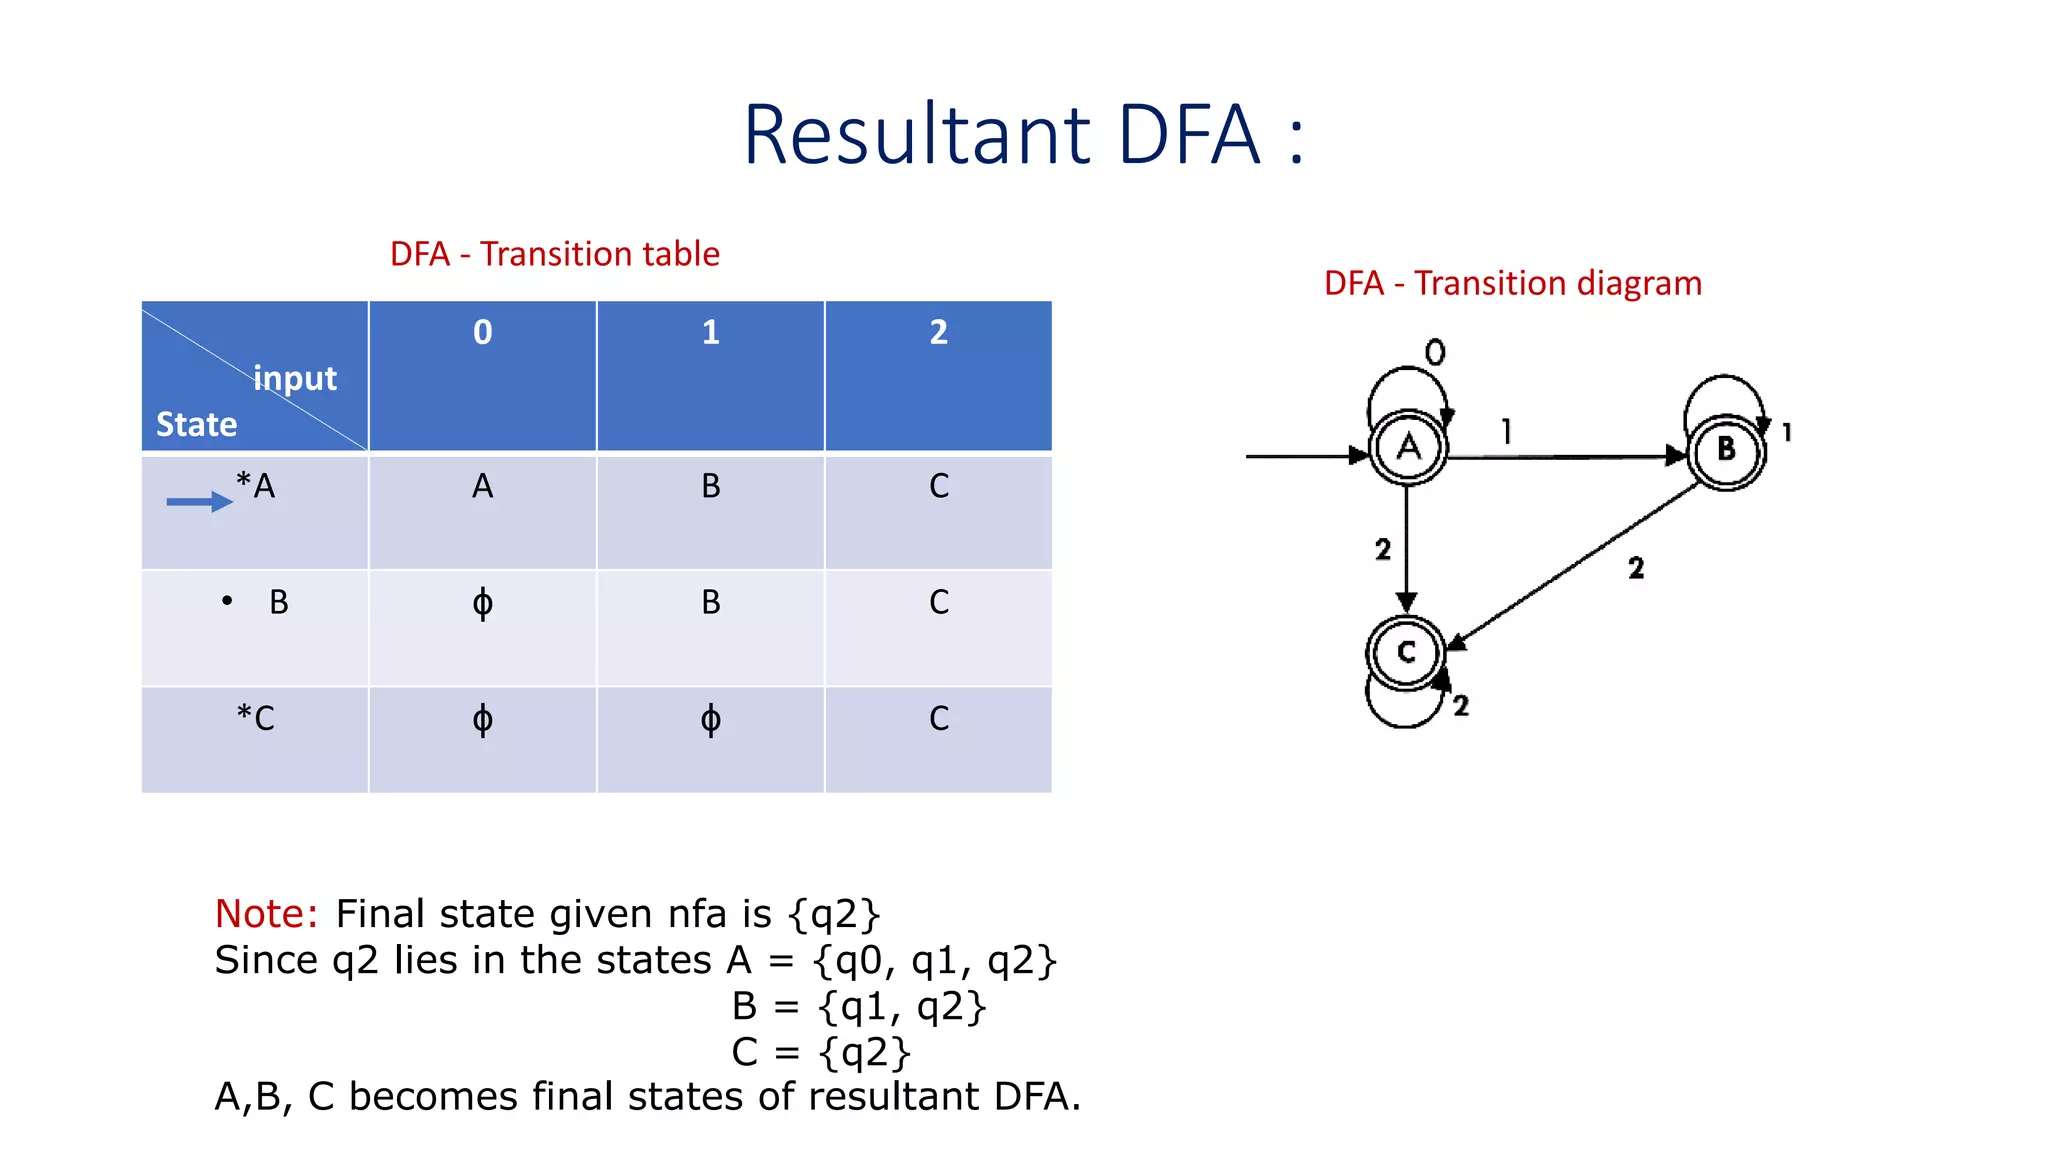
Create a table with rows for states A, B, and C, and columns for symbols 0, 1, and 2. Fill in the next state for each combination, and be sure to mark the start and final states according to convention (e.g., -> for start, * for final).
Click here to see the solution
Here is the completed transition table for the given DFA.
| State | 0 | 1 | 2 |
|---|---|---|---|
| **->**A | B | A | C |
| B | B | A | C |
| **C | B | A | C |
How to verify:
- The start state is A, marked with
->. The final states are A and C, marked with*. - From state A, the arrow labeled '0' goes to B. So, the entry for (A, 0) is B.
- From state A, the arrow labeled '1' loops back to A. So, the entry for (A, 1) is A.
- From state B, the arrow labeled '2' goes to C. So, the entry for (B, 2) is C.
...and so on for all other transitions.
From Transition Table to State Diagram
The reverse process—creating a diagram from a table—is just as straightforward. You simply work backwards:
- Read the states: Look at the first column of the table to find all the states. Create a circle (node) for each one.
- Identify start/final states: Use the
->and*markers to identify the start state (draw an incoming arrow to it) and the final states (draw them as double circles). - Draw the transitions: Go through each cell of the table. For an entry
T[State_X, Symbol_Y] = State_Z, you draw a directed arc from the circle forState_Xto the circle forState_Zand label it withSymbol_Y.
Your Turn: From Table to Diagram
Let's practice this direction. You might recognize the following transition table from an exercise in our previous lesson. Draw the state diagram that represents this DFA.
| State | 0 | 1 |
|---|---|---|
| **->**0 | 0 | 1 |
| 1 | 2 | 0 |
| 2 | 1 | 2 |
Describe your resulting diagram (how many states, which are start/final, and a few key transitions) and then check your work against the solution.
Click here to see the solution
Your state diagram should have the following features:
- Three states: Circles labeled 0, 1, and 2.
- Start state: An arrow with no source points to state 0.
- Final state: State 0 is drawn as a double circle.
- Transitions:
- A loop on state 0 labeled '0'.
- An arrow from state 0 to state 1 labeled '1'.
- An arrow from state 1 to state 2 labeled '0'.
- An arrow from state 1 back to state 0 labeled '1'.
- An arrow from state 2 to state 1 labeled '0'.
- A loop on state 2 labeled '1'.
Why Two Representations? Diagrams vs. Tables
You might be wondering why we need both state diagrams and transition tables. They represent the exact same information, but they serve different purposes:
- State Diagrams are visual and intuitive. They are excellent for designing a machine, explaining its logic to others, and getting a high-level "feel" for how it behaves.
- Transition Tables are structured and formal. This format is ideal for implementation. A program can easily use a 2D array or a similar data structure to represent the table and perform the state transitions, making it fast and efficient.
This connection to implementation is a key reason why tables are so important in practice, particularly in areas like building lexical analyzers for programming languages.
This document explains how a transition table is used to build a scanner, which is a core component of a compiler.
Read the section starting with 'A DFA is represented by a transition table T...' (on page 2). Notice the example table and the pseudo-code for a scanner that uses it. This directly shows the practical utility of the table format.
Conclusion
This lesson completes our tour of the fundamental ways to describe a DFA. You are now equipped to work with these machines using their formal definition, visualize them with state diagrams, and structure them for implementation with transition tables.
Key Takeaways:
- A transition table is a tabular representation of a DFA's transition function .
- It is straightforward to convert a state diagram to a transition table by systematically listing the destination state for every state/symbol pair.
- It is just as easy to convert a transition table to a state diagram by drawing nodes for states and arcs for transitions.
- State diagrams are best for human intuition and design, while transition tables are ideal for efficient computer implementation.
This concludes Module 1! You now have a robust understanding of what a DFA is and how it works.
Preview of the Next Lesson:
In our next lesson, we will begin Module 2: Designing Deterministic Finite Automata. We will move beyond simply describing existing machines and start creating our own DFAs to recognize specific, simple languages. This is the first major step toward your goal of modeling real-world systems.