Introduction
Welcome back! In our previous lesson, we walked through the process of conducting a Gage R&R study, from planning and part selection to collecting data and generating the analysis in Minitab. You learned that the study's output is a set of numbers and graphs that quantify the variation from your measurement system.
Now, we move to the most critical step: making a decision. This lesson directly addresses the learning outcome: Interpret Gage R&R results to determine if a measurement system is acceptable for process analysis. We will translate the statistical output into a practical verdict: Is this measurement system good enough for its job, or is it introducing too much noise and putting your project at risk?
Mastering this skill is crucial. An incapable measurement system can hide the true sources of process variation, leading you to waste time and resources "fixing" problems that don't exist or, worse, failing to fix the ones that do. Let's learn how to make the right call.
1. The Key Acceptance Criteria
After running a Gage R&R study, statistical software provides several key metrics to evaluate your measurement system. The Automotive Industry Action Group (AIAG) has established standard guidelines for these metrics, which are widely used in manufacturing.
There are four primary criteria we use to judge the capability of a measurement system:
- % Study Variation (%StudyVar): The percentage of the total variation in the study that is consumed by measurement error.
- % Tolerance (P/T Ratio): The percentage of the customer's specification width (tolerance) that is consumed by measurement error.
- % Contribution: The percentage of total study variance (the square of standard deviation) attributable to the measurement system.
- Number of Distinct Categories (NDC): An index that represents how many separate groups of parts the measurement system can distinguish within the tested sample.
The first step in interpretation is deciding which metric is most relevant to your objective.
2. Choosing Your Primary Metric: Process Control vs. Product Control
The two most common metrics are % Study Variation and % Tolerance. The one you choose depends on the primary purpose of your measurement.
-
Use % Tolerance (P/T Ratio) for Product Control: If your main goal is to sort parts—to determine if they conform to specifications and can be shipped to the customer—then % Tolerance is your metric. It directly compares the measurement error to the specification limits.
-
Use % Study Variation for Process Control: If your main goal is to understand and reduce the variation in your process, perhaps using control charts, then % Study Variation is your metric. It compares the measurement error to the natural variation of the process itself.
The following video explains this choice and introduces the fundamental concepts of interpreting the results.
Gauge R&R - How to Analyze and Understand your Results (Part 3)!!!
This video from Green Belt Academy clarifies when to use the Precision-to-Tolerance ratio versus the Percent of Total Process Variation. It sets the stage for using these metrics to evaluate your measurement system.
Watch from the beginning (0:20) to 7:37. Focus on understanding the difference between 'product control' and 'process control' and how that dictates which evaluation method you should use.
3. The AIAG Acceptance Guidelines
Once you've chosen your primary metric, you compare your results against the industry-standard AIAG guidelines. These are typically presented in a "traffic light" format (Green, Yellow, Red).
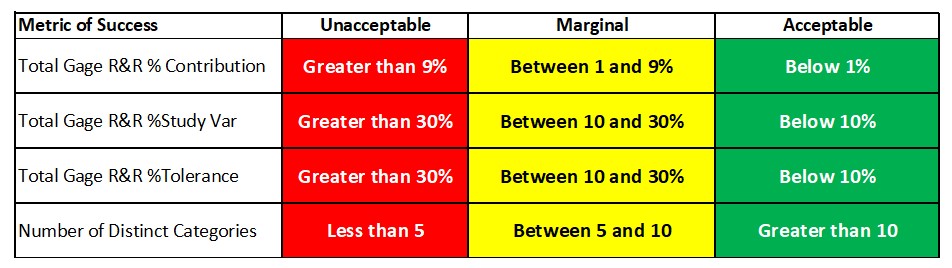
Let's break down these rules:
| Metric | Acceptable (Green) | Marginal (Yellow) | Unacceptable (Red) |
|---|---|---|---|
| % Study Variation | < 10% | 10% - 30% | > 30% |
| % Tolerance | < 10% | 10% - 30% | > 30% |
| % Contribution | < 1% | 1% - 9% | > 9% |
| Number of Distinct Categories | ≥ 5 | 2 to 4 | 1 |
Note: % Contribution uses different thresholds (1% and 9%) because it's based on variance, not standard deviation. It's more sensitive to measurement error.
A measurement system must be acceptable across all relevant criteria. The most critical metrics for a go/no-go decision are % Study Variation (or % Tolerance) and the Number of Distinct Categories.
This video provides a practical walkthrough of finding these values in a Minitab output and applying the rules.
GRR - Gage R&R Study (Crossed): MSA Tools with Examples | GRR Study
This video by LEARN & APPLY demonstrates how to locate and interpret the key results in a Minitab session window, including %Contribution, %StudyVar, and the Number of Distinct Categories.
Watch from 3:44 to 6:35. Pay close attention to where each of the key metrics is located in the output table and how the narrator applies the AIAG guidelines to them.
4. What to Do in the "Marginal" Zone (The Yellow Light)
An "Acceptable" result is great, and an "Unacceptable" result clearly requires action. But what do you do with a "Marginal" result (e.g., %StudyVar is 22%)?
A marginal gage may be acceptable depending on the context. You must consider the risks:
- Producer's Risk (False Rejects): You produce a perfectly good part, but the measurement error makes it look bad, so you scrap it. This costs money and reduces efficiency.
- Consumer's Risk (False Accepts): You produce a defective part, but the measurement error makes it look good, so you ship it to the customer. This creates quality problems and damages your reputation.
When your gage is marginal, you must weigh these risks against the cost and difficulty of improving the measurement system. If the measurement is for a non-critical feature, or if the process is highly capable (e.g., Cpk > 1.67), you might decide to accept the marginal system. If the feature is critical to safety or function, you must improve the measurement system.
Gauge R&R - How to Analyze and Understand your Results (Part 3)!!!
This final segment from the Green Belt Academy video explains the interpretation guidelines and, importantly, the business risks associated with having a marginal or 'mediocre' Gage R&R result.
Watch from 12:39 to 15:09. Focus on the definitions of producer's risk (false rejects) and consumer's risk (false accepts). This will help you make informed decisions when your results fall into that 10% to 30% gray area.
5. Troubleshooting an Unacceptable System: Graphical Analysis
If your Gage R&R is unacceptable or marginal, the next step is to diagnose the problem. Is the issue with the equipment (Repeatability) or the operators (Reproducibility)? The graphical output from your study provides the clues.
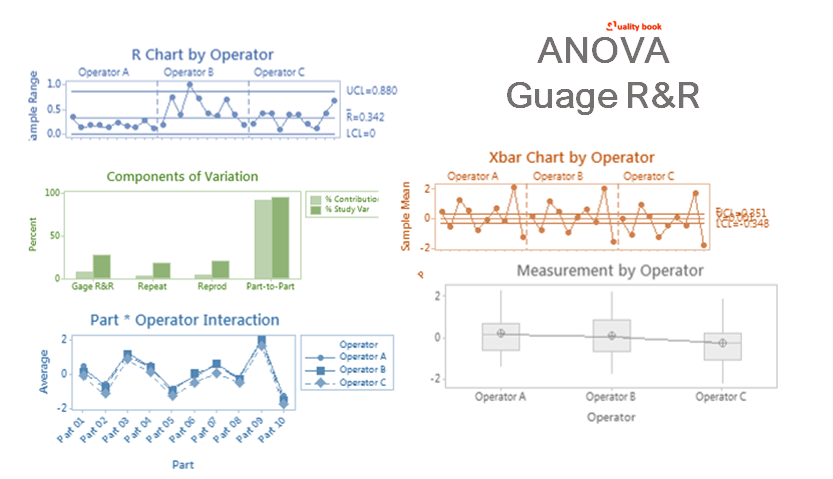
To understand how to read these charts, please study the following article. It provides a chart-by-chart guide to interpreting Minitab's Gage R&R six-pack report.
Interpreting Minitab's Gage R&R Chart
This article, 'Interpreting Minitab's Gage R&R Chart', is an excellent practical guide. It explains what to look for in each of the six standard graphs to pinpoint the source of measurement variation.
Please read the article starting from the section 'Components of Variation' to the end. For each chart type described (Components of Variation, Range Chart, Xbar Chart, etc.), focus on understanding what a 'good' chart looks like versus a 'bad' one and what it tells you about the source of the problem.
Here is a summary of what to look for:
- Components of Variation Chart: Your primary diagnostic tool. It visually shows if the largest component of gage error is Repeatability or Reproducibility. If Reproducibility is high, you have an operator problem. If Repeatability is high, you have an equipment or method problem.
- R Chart by Operator: Assesses repeatability. All points should be in control. An out-of-control point indicates that an operator was inconsistent when measuring a specific part.
- Xbar Chart by Operator: Assesses the system's ability to distinguish parts. This chart should look out of control, with most points outside the control limits. This shows that the variation between parts is much greater than the measurement error.
- Measurements by Operator (or Box Plot): Compares operators. The average lines for each operator should be roughly equal. If one operator is consistently higher or lower, you have a reproducibility problem.
- Part-Operator Interaction Plot: Looks for inconsistencies where some operators measure certain parts differently than others. The lines should be parallel, indicating no interaction.
6. A Practical Caution: The Part Selection Trap
Finally, even with perfect execution and interpretation, a Gage R&R study can be misleading if the initial part selection was flawed. As we discussed in the last lesson, the parts for the study must represent the full range of normal process variation.
The following case study illustrates this pitfall perfectly and introduces a useful "sanity check" metric called Category Resolution.
Case Study: Use Category Resolution to Assess Gage R&R Results
This iSixSigma case study demonstrates how improper part selection can lead to completely wrong conclusions about your measurement system. It's a critical lesson for any practitioner.
Please read the entire article. Pay close attention to the two scenarios: the AoC facility, where selecting parts that are too different makes a bad gage look good, and the CoUS facility, where selecting parts that are too similar makes a good gage look bad. Understand how calculating the 'Category Resolution' provides a practical reality check.
The key takeaway is that you can't just trust the %Gage R&R value alone. By calculating the Category Resolution (Part Range / Number of Distinct Categories), you get a practical feel for your gage's power. For example, a resolution of 2.06 lbs means your scale can only reliably distinguish between weights that are more than 2.06 lbs apart. If your tolerance is +/- 1 lb, this gage is clearly not up to the task, no matter what the %Gage R&R says.
Conclusion
You now have the tools to move beyond simply generating Gage R&R results to confidently interpreting them and making sound business decisions. This is a core competency for a Six Sigma Green Belt.
Key Takeaways:
- A measurement system is judged "Acceptable," "Marginal," or "Unacceptable" based on AIAG guidelines for four key metrics: %StudyVar, %Tolerance, %Contribution, and Number of Distinct Categories (NDC).
- The go/no-go criteria are generally <10% for %StudyVar/%Tolerance and an NDC of 5 or more.
- Marginal systems (10-30% %StudyVar) require a risk assessment: weigh the cost of improvement against the risks of making bad parts (consumer's risk) or scrapping good ones (producer's risk).
- If a system is unacceptable, use the graphical outputs to diagnose whether the root cause is with the equipment (Repeatability) or the operators (Reproducibility).
- Always perform a sanity check on your results, considering the range of parts used in the study and what the Category Resolution implies about the gage's practical discrimination power.
Preview of the Next Lesson:
We have focused on continuous data, which involves measurements on a scale. But what about inspections that result in a simple pass/fail or a defect classification? In our next lesson, we will tackle this by learning how to perform an attribute agreement analysis to validate a visual inspection system.