Introduction
In our last lesson, we learned how to construct and perform a basic interpretation of control charts. We established that the primary goal is to distinguish between common cause variation (the natural "noise" in a process) and special cause variation (signals that something has changed). You learned to recognize the most apparent signal: a point falling outside the 3-sigma control limits.
This lesson builds directly on that foundation to address the learning outcome: Identify common out-of-control signals and patterns on a control chart using standard industry rules (e.g., Nelson Rules). While a point outside the limits is a clear signal of a large shift, many other non-random patterns can reveal more subtle process changes like drifts, shifts, or cycles. Mastering the detection of these patterns is a key skill in moving from reactive problem-solving to proactive process control. We will systematically explore the widely used Nelson Rules to build your diagnostic toolkit for "listening" to the voice of your process.
Beyond the Limits: A Deeper Look at Process Signals
Relying solely on points outside the control limits (Rule 1) is like only listening for shouts in a conversation; you might miss the important whispers and changes in tone. To increase the sensitivity of our control charts, statisticians like Lloyd S. Nelson developed additional rules to detect patterns that are statistically unlikely to occur in a random, stable process.
These rules often reference "zones" on the control chart, which are defined by standard deviations () from the centerline:
- Zone C: Within of the centerline.
- Zone B: Between and from the centerline.
- Zone A: Between and from the centerline.
Let's explore these rules in detail to understand what they detect and what they might signify in a manufacturing environment.
The 8 Nelson Rules for Detecting Special Causes
The video below provides a comprehensive walkthrough of the eight Nelson Rules, including the logic behind them and what they are designed to detect.
The video 'SPC Control Charting Rules' from The Engineering Toolbox Channel offers a detailed explanation of each of the eight Nelson rules. It will serve as our primary guide for this section.
Please watch the segment from 03:25 to 07:46. The video will explain each of the eight rules. As you watch, focus on the specific pattern described by each rule and the type of process issue it's designed to detect (e.g., shift, trend, mixture).
To solidify your understanding, let's summarize each rule with a focus on its practical implications in manufacturing.
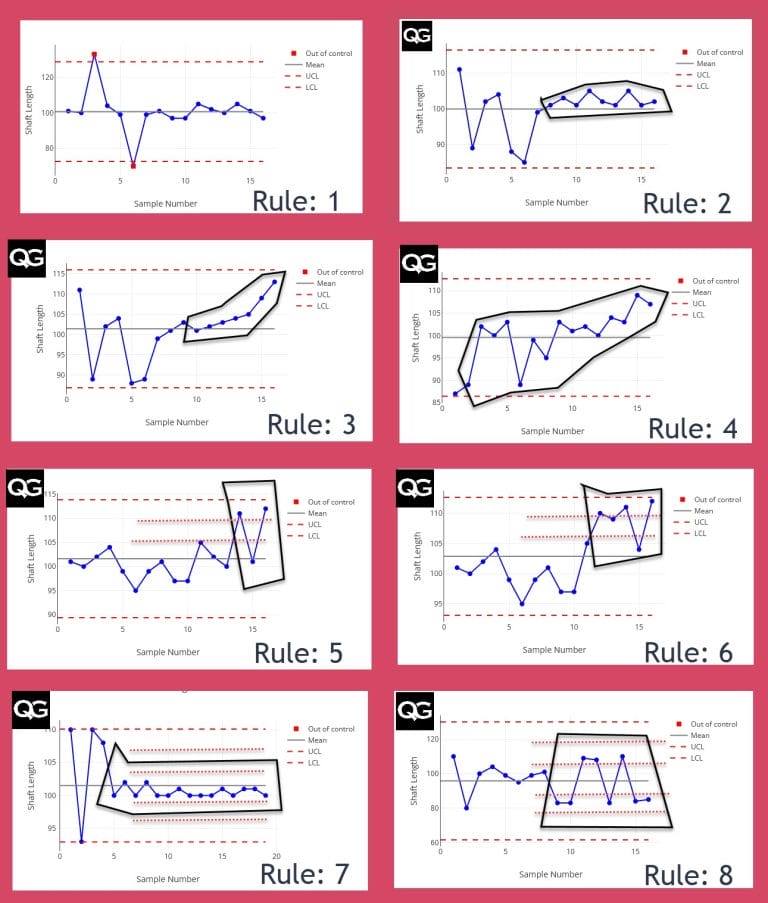
1. One point is more than 3 from the centerline.
- What it detects: A single, large process deviation. This is the most basic and strongest evidence of instability.
- Potential Causes: A new or untrained operator, an incorrect machine setup, a power surge, a defective batch of raw material.
2. Nine (or more) consecutive points on the same side of the centerline.
- What it detects: A small but sustained shift in the process average.
- Potential Causes: A new lot of material with slightly different properties, a subtle change in an environmental factor (e.g., humidity), a new measurement device that is not perfectly calibrated to the old one, slight tool wear.
3. Six (or more) consecutive points are continually increasing or decreasing.
- What it detects: A trend or gradual drift in the process.
- Potential Causes: Progressive tool wear, deteriorating machine performance, operator fatigue over a shift, gradual temperature changes in the facility.
4. Fourteen (or more) consecutive points alternate in direction (up and down).
- What it detects: Systematic oscillation. This often indicates over-control, where an operator is making adjustments after each measurement.
- Potential Causes: Operator "tampering" with the process, or systematically alternating between two different machines, two suppliers, or two measurement gauges.
5. Two out of three consecutive points are more than 2 from the centerline (in Zone A or beyond, on the same side).
- What it detects: An early warning of a moderate process shift. It increases the chart's sensitivity to detect shifts before they go out of the 3 limits.
- Potential Causes: Similar to a shift (Rule 2), but perhaps representing a larger change that is just beginning to manifest.
6. Four out of five consecutive points are more than 1 from the centerline (in Zone B or beyond, on the same side).
- What it detects: A small, developing shift. This rule is even more sensitive than Rule 5 and can indicate that the process mean is beginning to drift away from the center.
- Potential Causes: Early-stage tool wear, a minor change in material properties.
7. Fifteen (or more) consecutive points are within 1 of the centerline (in Zone C).
- What it detects: Stratification, or unnaturally low variability. It looks good, but it often isn't.
- Potential Causes: Incorrectly calculated control limits (e.g., using old data from a more variable process), or a flawed sampling method where subgroups contain a mix of high and low measurements that average out near the centerline.
8. Eight (or more) consecutive points are outside 1 of the centerline (on both sides, in Zones A or B).
- What it detects: A mixture pattern, suggesting the data is coming from two different populations with different means. This results in a bimodal data distribution.
- Potential Causes: Plotting data from two different shifts, machines, or material suppliers on the same chart without differentiating them.
For a consolidated view that ties these rules directly to potential causes, the following image is an excellent reference.

To reinforce these concepts with a text-based guide and example, please review the following article.
Control Phase: A Complete Guide to Understanding Control Chart Interpretation Rules
The article 'Control Phase: A Complete Guide to Understanding Control Chart...' provides clear descriptions of the rules and applies them to a practical manufacturing example of producing metal rods.
Read the section titled 'The Eight Essential Control Chart Interpretation Rules'. Pay attention to how each rule is explained using the sample dataset of metal rod diameters.
Practical Considerations for Applying the Rules
Applying these rules is not an all-or-nothing affair. As a Six Sigma practitioner, you must decide which rules to apply based on your process and resources. Using more rules makes your chart more sensitive, but it also increases the chance of a "false alarm"—a signal that occurs due to random chance, not a special cause.
The video we watched earlier has an excellent segment on this trade-off.
Let's return to the 'SPC Control Charting Rules' video to discuss some of the practical challenges and best practices for using these rules.
Please watch the final segment of the video from 07:46 to 10:33. Focus on the discussion of: The priority of Rule 1 signals. The trade-off between chart sensitivity and the risk of false positives. The concept of diminishing returns as more rules are added.
Key considerations for implementation:
- Start Simple: Most quality software allows you to select which tests to run. Often, practitioners start with a limited set (e.g., Rules 1, 2, 3, and 5) and add more only if necessary.
- Prioritize Signals: A Rule 1 violation is always the highest priority and demands immediate investigation. Signals from other rules, while important, may represent smaller shifts that can be scheduled for investigation.
- Know Your History: These rules are often a blend of the Western Electric Rules and Nelson Rules. They are very similar, with minor differences in the number of points required for a signal. The resource "Nelson Rules (and Western Electric Rules) for Control Charts" (ID: LINK) provides a useful comparison table if you encounter both terminologies.
Conclusion
In this lesson, you have expanded your ability to interpret control charts far beyond the basic upper and lower limits. You now have a systematic set of rules—the Nelson Rules—to detect non-random patterns that signal a process is affected by special cause variation.
Key Takeaways:
- The Nelson Rules are a set of eight tests that increase a control chart's sensitivity to detect non-random patterns like shifts, trends, and mixtures.
- Each rule points to a different type of process behavior, providing valuable clues for root cause investigation. For example, a trend (Rule 3) suggests a gradual cause like tool wear, while a shift (Rule 2) points to an abrupt event like a material change.
- A pattern of too little variation (Rule 7) can be as much of a red flag as too much variation.
- Applying these rules requires a practical balance; using more rules increases sensitivity but also raises the risk of false alarms that consume investigative resources.
Preview of the Next Lesson:
Detecting a signal is the first step. The crucial next step is knowing how to react. In our next lesson, we will address the learning outcome: Develop an appropriate response plan for specific out-of-control signals in a manufacturing process. We will discuss how to move from signal detection to a structured, effective investigation and response, ensuring that you not only find the root cause but also implement actions to prevent its recurrence.