Introduction
In the last lesson, we built the most critical slide of your audit report: the "Proposed Roadmap & Next Steps." That slide is your closing argument, the part that transforms your findings into a high-value redesign proposal. But a powerful closing needs a compelling story leading up to it.
This lesson is about building that story. Today, we will construct the entire professional audit report template around that final slide. Your goal is to build a reusable, professional audit report template in Figma.
Think of this template not as a document, but as a product. It's a core part of the $3k-$5k audit package you're selling. It needs to communicate authority, clarity, and most importantly, it must be structured to persuade a founder or product manager that your findings are urgent business problems that you are uniquely qualified to solve.
1. The Anatomy of a High-Stakes Audit Report
A winning report isn't a long, meandering list of every little thing you found. It's a strategic narrative designed for a busy decision-maker. It starts with the conclusion (the business impact) and then provides just enough evidence to make that conclusion undeniable.
Your Figma template will have a clear, repeatable structure. Each section has a specific job in the sales process.
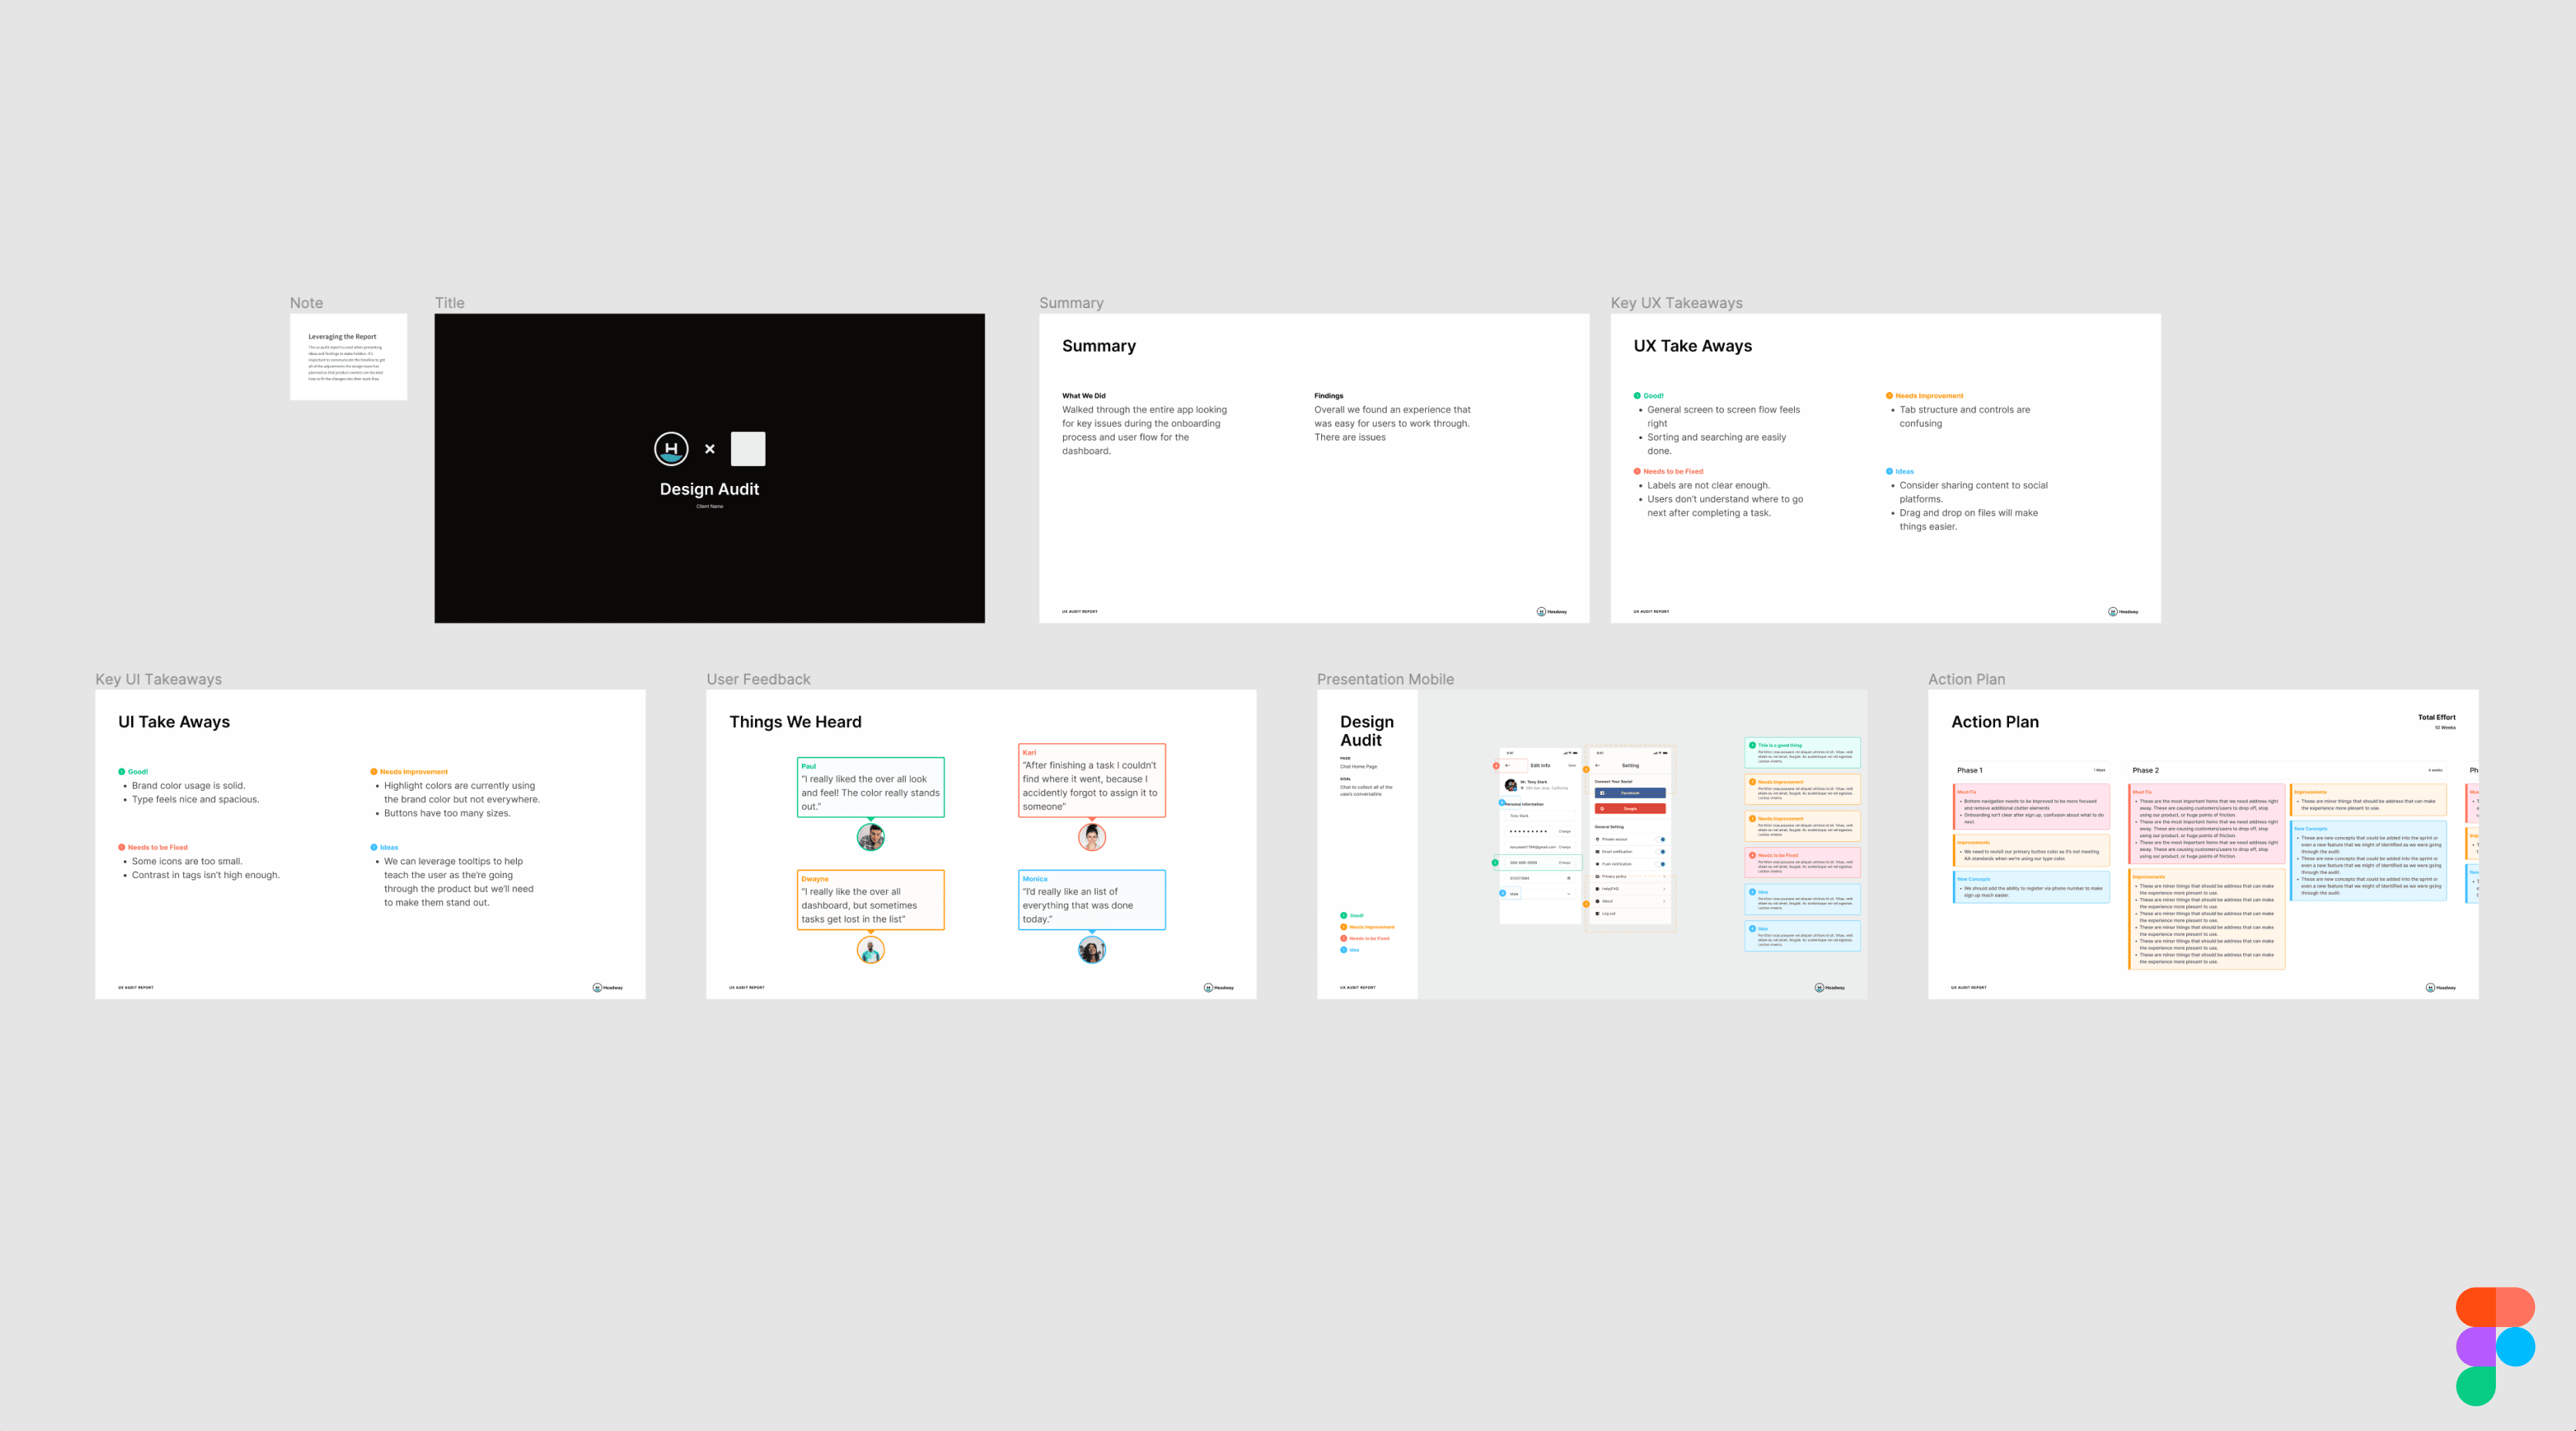
Here are the essential sections for your template:
- Cover Page: Simple, professional. Client logo, your logo, project title ("UX Audit & Growth Roadmap for [Client Name]"), and the date.
- Executive Summary: The single most important page. Assume the CEO will only read this. It must summarize the key business problem, the total potential revenue loss/gain, and a high-level preview of your core recommendation.
- Methodology & Scope: One slide. Briefly state how you conducted the audit (e.g., "Heuristic evaluation, GA4 funnel analysis, and session recording review") and what you focused on (e.g., "The new user onboarding flow and pricing page"). This builds credibility without getting bogged down in process.
- The Findings: The body of the report. This is where you present the evidence—the annotated screenshots and issue breakdowns. We will use a highly structured, repeatable format for this.
- ROI Summary: Before presenting your roadmap, you'll have a dedicated slide that aggregates the financial impact of the most critical issues. This sets the stage for your proposal's price tag.
- Proposed Roadmap & Next Steps: The closing slide you designed in the last lesson.
2. Building the "Findings" Section: From Observation to Evidence
This is where you'll spend most of your time during an audit. It’s crucial to have a system for documenting issues clearly and consistently. The goal is to present each finding as a self-contained piece of evidence.
This video provides an excellent hands-on demonstration of a designer documenting findings directly in Figma. We'll adopt a similar, structured approach.
UI UX Audit & Analysis Tutorial | GYMSHARK Case Study Included | 2022
The video 'UI UX Audit & Analysis Tutorial' by Ari Pxl shows a practical workflow for capturing and annotating usability issues in Figma. We'll use this as a model for our 'Findings' pages.
Watch the section from 10:32 to 29:56. Pay close attention to how the presenter: Takes screenshots of specific UI states. Uses numbered annotations to pinpoint issues. Writes clear, concise descriptions for each numbered point. Then, watch from 29:56 to 32:19 to see how these findings are translated into a prioritized recommendations table. This is the raw material for your report.
Based on this workflow and best practices, each "Finding" in your report should contain:
- A Clear Title: e.g., "Confusing Search Pattern Creates Friction."
- Annotated Screenshot: The visual evidence.
- Observation: What is the problem? (e.g., "The 'close' and 'clear' icons in the search bar are visually similar and placed next to each other, creating a high risk of mis-clicks.")
- Business Impact: Why does it matter? Connect it to money. (e.g., "This leads to user frustration and abandonment of product discovery, directly impacting conversion rates.")
- Recommendation: What is the fix? (e.g., "Redesign the search experience to use a conventional 'X' for closing the modal and move the 'clear input' action inside the text field.")
- Severity Rating: A simple High/Medium/Low rating. This helps with prioritization.
You will create a master component in Figma for this structure so you can add new findings instantly.
3. The ROI Summary: Framing the Investment
After presenting individual findings, you need to zoom out and show the cumulative business impact. This is where you make the case for investment. A powerful way to do this is with a simple table that connects issue severity to financial loss.

Your ROI Summary slide will feature a similar table. It takes the individual "Business Impact" statements from your findings and aggregates them.
| Severity | Issue Example | Estimated Monthly Revenue Leak |
|---|---|---|
| High | Broken "Add to Cart" flow | ~$83,300 |
| Medium | Confusing pricing page labels | ~$21,000 |
| Low | Inconsistent button styling | ~$1,500 |
| Total | ~$105,800 |
Presenting this figure right before your "Proposed Roadmap" slide is a powerful move. It frames your project fee not as a cost, but as a small investment to reclaim a much larger sum of lost revenue.
4. Your Turn: Build the Master Template
It's time to build your reusable asset. Your goal is to create a polished, professional Figma file that you can duplicate for every new client, saving you hours and ensuring a consistent, high-quality deliverable.
We'll start with a solid foundation from an existing template and then customize it to fit our aggressive, sales-focused methodology.
Free UX audit template in Figma for designers & product teams
This article from Curiosum, 'Free UX audit template in Figma,' introduces and links to a well-structured template. We'll use this as our starting point.
First, read the section 'How to use the template' to understand the basic workflow. Then, go to the section 'Get the free UX Audit template' and click the link to duplicate the Figma file into your own account. This will be the base for your own master template.
Your Task (Est. 40 minutes):
Now that you have the Curiosum template in your Figma account, you will customize and enhance it.
-
Brand and Clean Up:
- Create a new page in the file named
[Your Name] - Master Template. - Copy the core frames from the original template onto your new page.
- Delete any instructional or promotional content from Curiosum.
- Create a simple "Branding" page where you can easily swap out your logo and the client's logo using component properties. Apply these to the cover page.
- Create a new page in the file named
-
Create the "Finding" Component:
- Design a new frame that will serve as your master "Finding" slide.
- Structure it with placeholders for:
Finding Title(e.g., "1.1 - Ineffective Location Detection")Severity(High/Medium/Low tag)- A large area for an
Annotated Screenshot - Text boxes for
Observation,Business Impact, andRecommendation.
- Turn this frame into a component. This is the most important part of your template.
-
Build the Key Slides:
- Executive Summary: Create a slide with a large text block for the summary and 2-3 key metric callouts (e.g., "Potential Revenue Lift: +$25k/mo").
- ROI Summary: Recreate the ROI table shown above. Make the table cells and rows components so you can easily add or remove items.
- Assemble the Report: Create an instance of each of your key slides in the correct order:
- Cover Page
- Executive Summary
- Methodology & Scope
- An instance of your "Finding" component (as a placeholder)
- ROI Summary
- The "Proposed Roadmap & Next Steps" slide you designed in the previous lesson.
-
Save as Your Master: Rename the file to
SaaS UX Audit Report Template. This is now your personal, high-value deliverable for all future audits.
Conclusion
You have now built one of the most valuable assets in your consulting toolkit. This professional, reusable Figma template does more than just present findings; it's a sales machine. It saves you time, ensures every report you deliver is polished and persuasive, and is structured to guide your client toward a logical conclusion: hiring you for the follow-up project.
Key Takeaways:
- Your Report is a Product: Treat your audit report template as a core business asset. It must be professional, reusable, and designed to sell.
- Structure is Strategy: The order of your report (Exec Summary -> Evidence -> ROI -> Roadmap) is a strategic narrative designed for a busy executive.
- The "Finding" Component is Your Workhorse: A well-designed master component in Figma for documenting individual issues is the key to efficiency and consistency.
- Always Connect to Money: The ROI Summary slide is non-negotiable. It bridges the gap between technical UX issues and tangible business problems, justifying your proposed fee.
Preview of the Next Lesson:
You have the report that demonstrates the problem and creates the demand for a solution. The client is convinced they need to act. Their next question is, "So, what will this cost?" In the next module, "Value-Based Pricing & Bulletproof Proposals," we will tackle this head-on. You will learn how to price your services based on the value you've just proven, create tiered pricing packages, and write the Statement of Work (SOW) that gets you paid.