Introduction
In our last session, you crafted the most critical part of your audit report: the executive summary. You now have a powerful tool to communicate the financial stakes of UX issues directly to a founder or product manager, framing your work in terms of ROI and business impact.
Now that you've captured the client's attention with the "what" and "why," it's time to provide the evidence. This lesson focuses on the "Detailed Findings" section of your report. This is where you move from high-level business problems to the specific, granular usability issues that cause them. Your goal is to create a visual, undeniable record of every problem you've uncovered.
Your learning outcome for this lesson is to document findings with annotated screenshots and clear severity ratings. By the end of this session, you will have a structured process for presenting your findings in a professional, client-ready format within Figma.
1. Showing, Not Just Telling: The Power of Annotation
Your findings section is a visual conversation with the client's team. Instead of just describing a problem in text, you need to show them exactly where it occurs. This is done through annotation: marking up screenshots of the product's UI to pinpoint issues.
A common workflow is to gather all your screenshots and observations in a working file, almost like a digital whiteboard, before creating the final polished report slides.

Once you have your raw findings, you need to translate them into a structured, professional format. The following video provides a masterclass on how to do this systematically within Figma.
UI UX Audit & Analysis Tutorial | GYMSHARK Case Study Included | 2022
In this video, 'UI UX Audit & Analysis Tutorial' by Ari Pxl, you'll see a detailed walkthrough of auditing the Gymshark website. The key part for us is how the presenter documents his findings.
Watch the segment from 12:28 to 25:30. Pay close attention to the repeatable process: 1) Take a screenshot of the UI. 2) Import it into Figma. 3) Use numbered dots to pinpoint the exact location of each issue. 4) Write a clear, numbered description that corresponds to each dot. This method creates an unambiguous record of every finding.
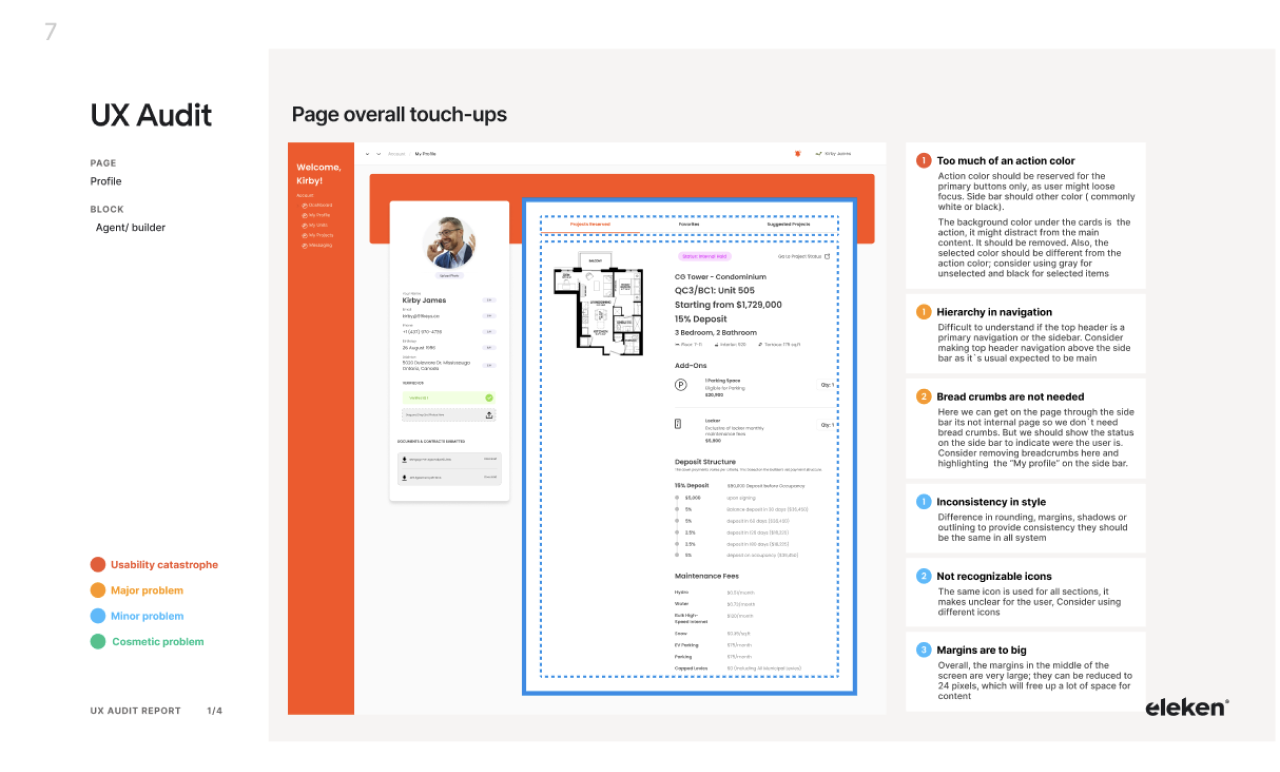
The process you just watched transforms a collection of observations into a clear, easy-to-follow analysis. When polished, it looks like this:
2. From Problem to Priority: Assigning Severity Ratings
A long list of issues can be overwhelming for a client. To make your audit actionable, you must help them prioritize. Not all UX problems are created equal. A button that prevents users from paying is a catastrophe; inconsistent spacing is a cosmetic flaw. Severity ratings are how you make this distinction clear.
The industry-standard framework for this is Jakob Nielsen's severity scale.
10 Usability Heuristics for UX Design
The article '10 Usability Heuristics for UX Design' provides the foundational knowledge for heuristic evaluation. We'll focus on the section that details how to rate the issues you find.
Read the section '3. Consolidate findings and assign severity ratings'. Focus on Nielsen’s 0–4 scale. This is the exact terminology you will use in your reports.
A rating is not just a gut feeling; it's an assessment based on specific criteria. To assign ratings accurately, you need to consider three factors for each issue.
A Proven Framework for Prioritizing UX Issues When Resources Are Limited
The article 'A Proven Framework for Prioritizing UX Issues' goes deeper into the 'why' behind a severity rating. This will give you a solid mental model for justifying your ratings to clients.
Read the section 'Measuring UX Issue Severity and Impact'. Internalize the 'Three Dimensions of Severity': Frequency, Impact, and Persistence. This framework is your key to defending your prioritization decisions.
Here is a practical translation of the Nielsen scale, combining it with the three dimensions, that you can use in your reports. This language frames the ratings in terms of business urgency.
| Rating | Nielsen's Term | Business Implication | Key Questions (Frequency, Impact, Persistence) |
|---|---|---|---|
| 4 | Usability Catastrophe | Fix Immediately. Blocks core user tasks (e.g., checkout, sign-up). Direct revenue loss or total user churn. | Does it block task completion? Is there no workaround? |
| 3 | Major Problem | High Priority. Causes significant user frustration or errors, but a workaround exists. High impact on conversion/retention. | How often will users encounter this? Does it create major friction? |
| 2 | Minor Problem | Low Priority. Annoying but doesn't prevent task completion. Users will likely find a way around it. | Is it just an irritation? Can users easily overcome it? |
| 1 | Cosmetic Problem | Fix if Time. Visual issue (e.g., alignment, inconsistent styles) that doesn't affect functionality. | Does it impact usability or just aesthetics? |
| 0 | Not a problem | N/A | Issue is subjective or doesn't violate any usability principles. |
Now, let's see this in practice. Watch how the presenter from the Gymshark audit applies a severity rating to a major issue he discovered.
UI UX Audit & Analysis Tutorial | GYMSHARK Case Study Included | 2022
Let's return to the Ari Pxl video. Now that you understand the severity framework, watch how he translates his finding into a recommendation with a clear severity rating.
Watch from 29:43 to 30:45. Notice how he rates the location-detection issue as an 'S4... usability catastrophe' and justifies it by explaining the negative impact on the user journey (wasting time, frustration at checkout). This is exactly how you should articulate your major findings.
3. Practical Exercise: Build Your "Finding" Slide in Figma
It's time to build a reusable asset for your audit report template. Your task is to create a single, professional "Finding" slide in Figma that documents a set of hypothetical issues.
Scenario:
You are auditing the pricing page of a B2B SaaS product. You've identified three problems:
- Issue A (Major): The "Enterprise" plan is aimed at large companies, but there is no "Contact Sales" button. It's just unclickable text, completely blocking high-value leads.
- Issue B (Minor): The FAQ section at the bottom of the page has a broken link for "What payment methods do you accept?".
- Issue C (Cosmetic): The checkmark icons used in the feature list are inconsistent; some are green, and some are gray.
Your Task (Est. 20 minutes):
- Find a Specimen: Go to a real SaaS website (e.g., Asana, monday.com, Slack) and take a screenshot of their pricing page. This will be your base.
- Set Up Your Frame: In Figma, create a new frame (e.g., 1920x1080). Paste the screenshot.
- Create Your Legend: Replicating the style from the Eleken report image (LINK), create a small legend in the corner of your slide that defines your color-coding for severity ratings (e.g., Red = Major, Orange = Minor, Green = Cosmetic).
- Annotate the Issues:
- Place a numbered, color-coded marker on the screenshot for each of the three issues described above.
- Issue A: Use a red marker near the "Enterprise" plan text.
- Issue B: Use an orange marker on the broken FAQ link.
- Issue C: Use a green marker on the inconsistent checkmarks.
- Write Descriptions: To the side of the screenshot, create a numbered list corresponding to your annotations. For each issue, write:
- A short, clear title (e.g., "1. Missing CTA for Enterprise Leads").
- A 1-2 sentence description of the problem and its impact.
- The severity rating (e.g., Severity: 3 - Major Problem).
Your final output should be a single, polished slide that you can add to the reusable Figma report template you are building throughout this course.
Conclusion
You now have a systematic, professional method for documenting the evidence that backs up your executive summary. By presenting findings with annotated screenshots and clear severity ratings, you move beyond simple critique and provide a clear, prioritized, and actionable analysis that your client's team can immediately understand and act upon.
Key Takeaways:
- Show, Don't Tell: Annotated screenshots provide undeniable visual proof and eliminate ambiguity.
- Prioritize Ruthlessly with Severity Ratings: Use Nielsen's 0-4 scale to help clients focus on what matters most. A problem's severity is a function of its Frequency, Impact, and Persistence.
- Figma is Your Reporting Tool: Structure your findings in clean, professional slides to build a high-value deliverable that reinforces your expertise.
Preview of the Next Lesson:
Documenting problems is only half the battle. To truly provide value and secure a follow-up project, you must provide solutions. In the next lesson, we will focus on the final section of the report: writing measurable, actionable business recommendations that strategically lead the client toward hiring you for the redesign phase.