Hello! Welcome to the final lesson in our first module on pointer fundamentals.
So far, we have covered the core mechanics of pointers: what they are, how to declare and initialize them, how to use the address-of (&) and dereference (*) operators, and the architectural factors that determine a pointer's size.
Today, we will bring all these concepts together. Our goal is to trace pointer operations through memory diagrams for simple programs. This is a crucial skill. It allows you to build a robust mental model of how your code interacts with memory, moving beyond just knowing the syntax to truly understanding the execution flow. For someone with your experience using debuggers like Trace32 to inspect memory, this lesson will help you internalize that process, enabling you to predict and reason about program behavior before you even compile.
Visualizing Memory: The Box-and-Arrow Diagram
The most effective way to trace pointer operations is by drawing what's happening. We'll use a standard technique called a box-and-arrow diagram. The convention is straightforward:
- Boxes: Represent variables in memory. Each box has a name (the variable's identifier), a value (its contents), and an address (its location in memory).
- Arrows: Represent pointers. A pointer's value is a memory address. We draw an arrow from the pointer's box to the box at the address it stores.
This method turns abstract code into a concrete, visual sequence of events.
Pointers - Box-and-Arrow Diagrams
To see this convention in action, let's start with a foundational resource. The following lecture slides from the University of Washington introduce the box-and-arrow diagram with a clear, step-by-step example.
Please review slides 5 through 8 (titled 'Box-and-Arrow Diagrams'). Observe how each variable (x, arr, p) is given a box in the stack frame and how the pointer p is visualized as an arrow.
Tracing Pointer Operations Step-by-Step
Let's trace a simple program together to solidify the concept. Consider the following code:
#include <stdio.h>

int main(void) {
    int val1 = 100;
    int val2 = 200;
    int *p_val = NULL;

    // We'll trace from here
    p_val = &val1;
    *p_val = 150;
    val2 = *p_val;
    p_val = &val2;
    *p_val = val1;

    printf("val1: %d, val2: %d\n", val1, val2);
    return 0;
}
We'll visualize the stack memory for main. Let's assume some arbitrary addresses for our variables.
Initial State:
At the start of our trace, val1 is 100, val2 is 200, and p_val is NULL.
| Address | Name | Value |
|---|---|---|
0x7ffc100 |
val1 |
100 |
0x7ffc104 |
val2 |
200 |
0x7ffc108 |
p_val |
NULL (0) |
1. p_val = &val1;
The address of val1 (0x7ffc100) is assigned to p_val. We now draw an arrow from p_val to val1.
| Address | Name | Value |
|---|---|---|
0x7ffc100 |
val1 |
100 |
0x7ffc104 |
val2 |
200 |
0x7ffc108 |
p_val |
0x7ffc100 |
2. *p_val = 150;
We follow the arrow from p_val to val1 and change the value in that box to 150. val1 is now 150.
| Address | Name | Value |
|---|---|---|
0x7ffc100 |
val1 |
150 |
0x7ffc104 |
val2 |
200 |
0x7ffc108 |
p_val |
0x7ffc100 |
3. val2 = *p_val;
Again, we dereference p_val, which gives us the value of val1 (150). This value is assigned to val2.
| Address | Name | Value |
|---|---|---|
0x7ffc100 |
val1 |
150 |
0x7ffc104 |
val2 |
150 |
0x7ffc108 |
p_val |
0x7ffc100 |
4. p_val = &val2;
The address of val2 (0x7ffc104) is assigned to p_val. We erase the old arrow and draw a new one from p_val to val2.
| Address | Name | Value |
|---|---|---|
0x7ffc100 |
val1 |
150 |
0x7ffc104 |
val2 |
150 |
0x7ffc108 |
p_val |
0x7ffc104 |
5. *p_val = val1;
We dereference p_val (follow the arrow to val2) and assign it the current value of val1 (which is 150). val2 remains 150.
| Address | Name | Value |
|---|---|---|
0x7ffc100 |
val1 |
150 |
0x7ffc104 |
val2 |
150 |
0x7ffc108 |
p_val |
0x7ffc104 |
The final printf will output: val1: 150, val2: 150.
Tracing Multi-Level Pointers
The same technique extends to pointers to pointers. A pointer to a pointer simply holds the address of another pointer.
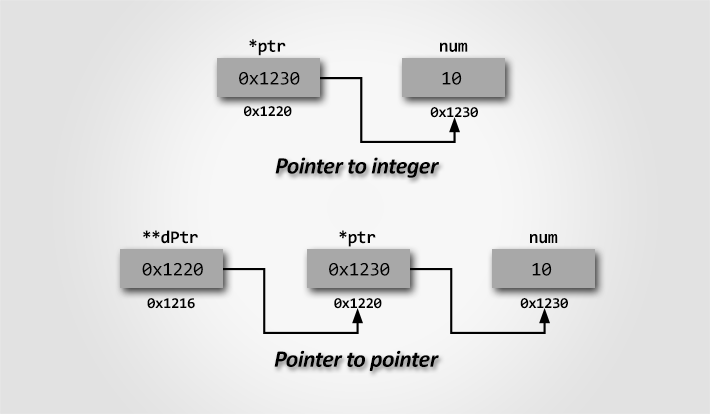
Let's trace a slightly more complex example that involves a pointer to a pointer.
The same resource from UW provides another excellent, step-by-step trace of a program using a double pointer.
Review slides 10 through 14. Pay close attention to how dp (a pointer to a pointer) points to p, and how the operation *(*dp) += 1 is resolved. It first dereferences dp to get to p, then dereferences p to get to arr[1] before modifying its value.
This example introduces an important concept: you can modify a pointer's value (p += 1;) and you can modify the value it points to (*(*dp) += 1;). The diagram makes it clear which variable is being affected by each operation.
Test your understanding!
Now it's your turn to apply this skill to a more comprehensive problem. This program involves passing pointers to a function. Remember that function arguments are copies, but when you pass an address (a pointer), the function can use that copied address to modify the original data in the caller's scope.
Task: Draw a box-and-arrow diagram to trace the following program. What does it print?
#include <stdio.h>

// Note: *(bar+1) is equivalent to bar[1]. We will cover this in detail next module.
int foo(int* bar, int** baz) {
    *bar = 5;
    *(bar+1) = 6;
    *baz = bar + 2;
    return *((*baz)+1);
}

int main(int argc, char** argv) {
    int arr[4] = {1, 2, 3, 4};
    int* ptr = NULL;

    arr[0] = foo(&arr[0], &ptr);

    printf("%d %d %d %d %d\n", arr[0], arr[1], arr[2], arr[3], *ptr);
    return 0;
}
Hint: You will need two sets of boxes: one for the main function's stack frame (arr, ptr) and another for the foo function's stack frame (bar, baz).
Show answer
Let's trace this step-by-step.
1. Initial state in main:
arris an array with values{1, 2, 3, 4}.ptris a pointer initialized toNULL.
2. Function Call: foo(&arr[0], &ptr)
- The address of the first element of
arris passed as the first argument. - The address of the pointer
ptris passed as the second argument.
3. Inside foo:
- A stack frame for
foois created. - The parameter
bar(typeint*) receives a copy of&arr[0]. So,barnow points toarr[0]. - The parameter
baz(typeint**) receives a copy of&ptr. So,baznow points tomain'sptrvariable.
Diagram after function call:
main's stack:
  arr: [1, 2, 3, 4]
  ptr: NULL

foo's stack:
  bar: (points to arr[0])
  baz: (points to main's ptr)
4. *bar = 5;
- Dereference
bar, which points toarr[0]. arr[0]is changed from 1 to 5.main'sarris now{5, 2, 3, 4}.
5. *(bar+1) = 6;
barpoints toarr[0].bar+1points to the next integer,arr[1].- Dereference
bar+1and change the value. arr[1]is changed from 2 to 6.main'sarris now{5, 6, 3, 4}.
6. *baz = bar + 2;
- This is the trickiest part.
- Dereference
baz, which points tomain'sptrvariable. This means we are about to change the value ofptritself. - The new value is
bar + 2. Sincebarpoints toarr[0],bar + 2is the address ofarr[2]. main'sptris changed fromNULLto point toarr[2].
Diagram after this line:
main's stack:
  arr: [5, 6, 3, 4]
  ptr: (points to arr[2])

foo's stack:
  bar: (points to arr[0])
  baz: (points to main's ptr)
7. return *((*baz)+1);
*baz: Dereferencebazto getmain'sptr.(*baz)is nowptr, which points toarr[2].(*baz) + 1: This isptr + 1, which is the address of the element afterarr[2], i.e.,arr[3].*((*baz)+1): Dereference that address. This gives us the value ofarr[3], which is still 4.- The function
fooreturns the value 4.
8. Back in main:
arr[0] = foo(...)- The return value from
foo(which is 4) is assigned toarr[0]. main'sarris now{4, 6, 3, 4}.
9. printf(...)
arr[0]is 4.arr[1]is 6.arr[2]is 3.arr[3]is 4.*ptr:ptrpoints toarr[2], so dereferencing it gives the value ofarr[2], which is 3.
Final Output:
The program will print: 4 6 3 4 3
Conclusion
You have now completed the final lesson of our foundational module. By learning to trace pointer operations visually, you've developed one of the most powerful mental tools for a C programmer.
Key Takeaways:
- Box-and-arrow diagrams provide a concrete way to visualize variables, their memory addresses, and the relationships between them.
- Tracing involves updating the values in boxes and redrawing arrows step-by-step as the program executes.
- This technique clearly distinguishes between changing a pointer's value (where it points) and changing the value at the location it points to.
- It is essential for understanding how functions can modify a caller's data via pointers, a cornerstone of C programming.
The exercise you just completed touched on bar + 1. This is a preview of our next topic: pointer arithmetic. In the next module, we will formally explore the rules of pointer arithmetic and its deep, fundamental relationship with arrays in C. This will be directly applicable to your work in processing communication buffers, traversing data packets, and implementing efficient algorithms in your automotive software projects.