Introduction
In the previous lesson, you architected a modular, multi-channel notification service, successfully decoupling a core business function from your main logic. Your CRM can now not only manage lead states autonomously but also communicate those changes to stakeholders in real-time. This separation of concerns is a hallmark of a mature, scalable system.
This lesson completes the Agency CRM Automation Core by addressing the final, critical requirement of any business system: reporting. Your objective is to create a separate data aggregation workflow to populate a reporting dashboard in Google Sheets.
Instead of burdening your real-time, transactional workflows (like lead intake) with heavy data processing, you will build a dedicated, scheduled workflow for analytics. This architectural pattern is non-negotiable in production environments. It ensures that reporting processes, which can be resource-intensive, do not impact the performance or reliability of your core operational systems. A failure in the reporting job must not prevent a new lead from being captured.
By the end of this lesson, you will have a complete, end-to-end CRM automation system with distinct layers for data capture, state management, notifications, and analytics—a powerful asset for your portfolio.
1. The Reporting Architecture: From Raw Data to Insight
A reporting dashboard provides a high-level, aggregated view of your system's performance. It transforms raw data (individual leads) into business intelligence (pipeline health, conversion rates). Building this requires a dedicated data flow.
The video below discusses the concept of "observability" and using external databases (like Google Sheets) to log events and build dashboards. This provides the professional context for why we're building a separate reporting system.
The Ultimate Guide to Building Production-Ready n8n Workflows
Watch this segment from 'The Ultimate Guide to Building Production-Ready n8n Workflows' by Bart Slodyczka. It explains how logging data to a clean, external source is the foundation for creating metrics, monitoring, and dashboards.
Watch from 04:16 to 06:01 and from 07:12 to 10:17. Focus on the core idea: a clean, organized database of events allows you to build powerful dashboards that aggregate that data. We will implement this concept by treating our CRM sheet as the primary data source and building an aggregation workflow to populate a dashboard.
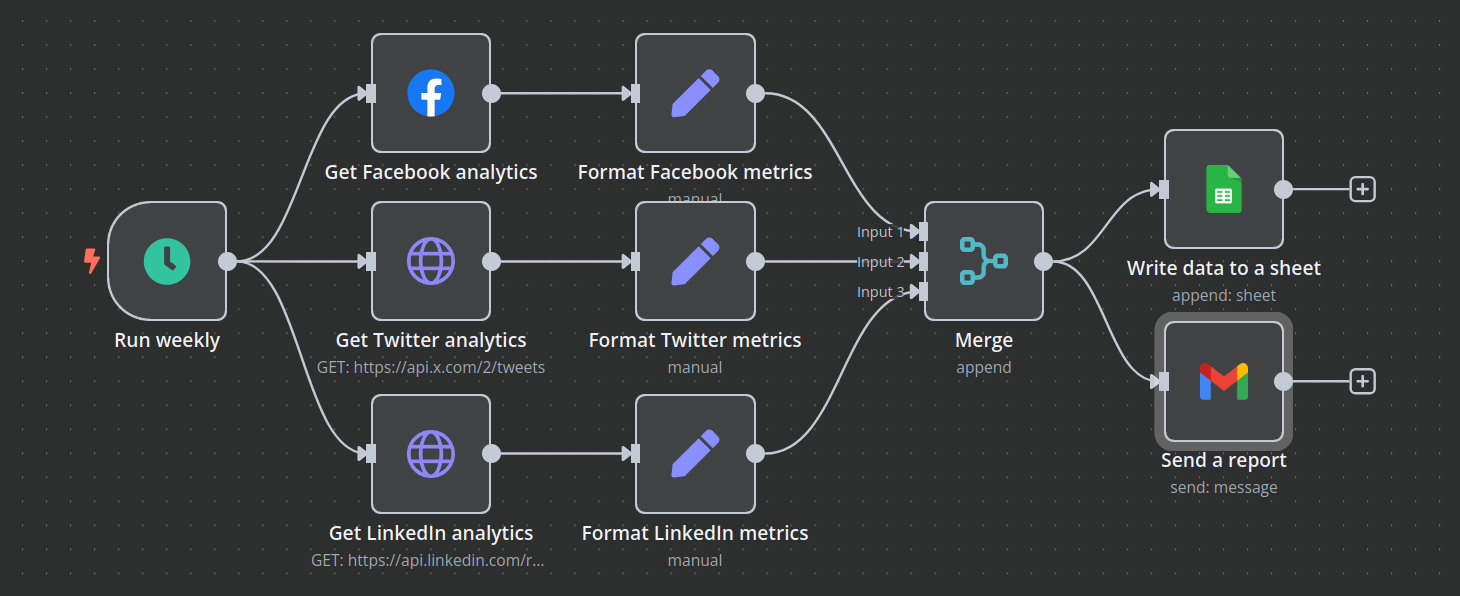
Our reporting architecture will consist of three parts:
- The Data Source: The main Google Sheet you've been using as your CRM, containing all lead data.
- The Aggregation Engine: A new, standalone n8n workflow, triggered on a schedule, that reads from the data source, calculates key metrics, and writes the results.
- The Dashboard: A new Google Sheet that will act as our BI dashboard. It will have two tabs:
Dashboard: A user-facing tab with charts and formatted metrics.Data_Sink: A hidden or protected tab where the n8n aggregation engine writes its calculated data. The charts in theDashboardtab will be powered by this data.
This pattern is common in data engineering. The n8n workflow serves as an ETL (Extract, Transform, Load) pipeline.
2. Building the Aggregation Engine
The core of this lesson is the aggregation logic. Given your background and the need for efficient processing, the Code node is the superior tool for this task. It allows you to perform all calculations in a single step using JavaScript, running once over the entire dataset.
This is far more performant than chaining multiple IF and Set nodes, especially as your lead volume grows.
Advanced Strategies for Managing Complex Data Flows in n8n
This section of the article 'Advanced Strategies for Managing Complex Data Flows in n8n' focuses on the Code node. It specifically demonstrates how to perform aggregate operations.
Read section '6.0 Data Manipulation: Advanced Control with the Code Node'. Pay close attention to the 'Run once for all items' execution mode and the example for calculating a total order value. You will use this exact pattern to calculate your CRM metrics.
Step-by-Step Implementation
-
Create the Workflow: Create a new workflow named
[REPORT] CRM Pipeline Summary. -
Add Schedule Trigger: Add a
Schedulenode and configure it to run at your desired interval (e.g., every day at 8 AM). -
Read CRM Data:
- Add a
Google Sheetsnode. - Operation:
Read Rows. - Configure it to read all data from your main CRM sheet (e.g.,
Sheet1!A2:Z). Ensure you read all columns needed for your metrics.
- Add a
-
Aggregate Metrics with the Code Node:
- Add a
Codenode. - Mode:
Run Once for All Items. - This is where you'll write your aggregation logic. Here is a starter template. You will need to adapt the
item.json.statusfield to match the exact column name in your Google Sheet.
// Initialize an object to hold our metrics const metrics = { totalLeads: 0, leadsByStatus: { 'New': 0, 'Contacted': 0, 'Replied': 0, 'Stale': 0, 'Won': 0, 'Lost': 0 }, conversionRate: 0, lastUpdated: new Date().toISOString() }; const allItems = $input.all(); // 1. Calculate Total Leads and Leads by Status metrics.totalLeads = allItems.length; for (const item of allItems) { const status = item.json.status; // <-- IMPORTANT: Change 'status' to your actual column header name if (status && metrics.leadsByStatus.hasOwnProperty(status)) { metrics.leadsByStatus[status]++; } } // 2. Calculate Conversion Rate (Won / (Won + Lost)) const won = metrics.leadsByStatus['Won']; const lost = metrics.leadsByStatus['Lost']; if (won + lost > 0) { metrics.conversionRate = won / (won + lost); } // 3. Return a single item with all calculated metrics return [{ json: metrics }]; - Add a
-
Write to Data Sink:
- You need to write these calculated values to your
Data_Sinksheet. A robust method is to use theAppend or Updateoperation. - Set up your
Data_Sinksheet with headers likeMetricName,MetricValue. - Before writing, use a
Split in Batchesnode set to a batch size of 1. This ensures theCodenode's single output item is processed correctly. - Then, add a
Google Sheetsnode configured forAppend or Update. You'll need to map the output of the code node to the correct structure to update rows whereMetricNamematches 'totalLeads', 'conversionRate', etc. This can be complex. - A more direct approach: For a simple key-value dashboard, use multiple
Google Sheetsnodes with theUpdate Celloperation. This is less "programmatic" but very explicit and easy to debug.- Example for 'Total Leads':
- Add a
Google Sheetsnode. - Operation:
Update Cell. - Sheet Name:
Data_Sink. - Cell:
B2(assuming A2 has the label 'Total Leads'). - Value:
{{ $('Aggregate Metrics').item.json.totalLeads }}
- Add a
- Chain several of these nodes to update each metric in its designated cell.
- Example for 'Total Leads':
- You need to write these calculated values to your
For a comprehensive guide on all possible Google Sheets operations, including Append or Update and batching, the following resource is invaluable.
How to Build Automated Google Sheets Data Sync with n8n
The article 'How to Build Automated Google Sheets Data Sync' covers every aspect of reading from and writing to Google Sheets, including performance optimization and error handling.
This is for reference. Skim these sections to understand the full capabilities: 'Step 3: Read Data' & 'Step 4: Apply...Transformation': Reinforces the pattern of reading and then processing data. 'Step 6: Write Data': Details the 'Append or Update' operation and the critical concept of batching for large datasets. 'Key Configuration Details': The 'Performance optimization' table is an excellent professional reference for scaling your solutions.
Practical Task: Deploy the Reporting Dashboard
Client Scenario: The Sales Director wants a "single source of truth" dashboard, updated daily, that gives them an at-a-glance overview of the entire sales pipeline. They are not interested in the individual lead records; they need aggregated KPIs to assess team performance and forecast revenue.
Required KPIs:
- Total number of leads.
- Count of leads in each status (
New,Contacted,Replied,Stale,Won,Lost). - Conversion Rate (defined as
Won / (Won + Lost)).
Deliverables
- Reporting Google Sheet Link: A public or shareable link to your new Google Sheet. It must contain:
- A
Dashboardtab with at least two charts (e.g., a pie chart for Leads by Status, a scorecard for Conversion Rate). - A
Data_Sinktab where n8n writes the aggregated data.
- A
- Workflow JSON: The exported JSON for your
[REPORT] CRM Pipeline Summaryworkflow. - Loom Walkthrough (max 5 minutes):
- Show your main CRM sheet with varied sample data (ensure there are leads in 'Won' and 'Lost' states for the conversion rate calculation).
- Show your Reporting Google Sheet, pointing out the
Data_Sinkand theDashboardtabs. - Walk through your
[REPORT] CRM Pipeline Summaryworkflow. Briefly explain the schedule trigger, the read step, and the JavaScript logic in yourCodenode. - Execute the workflow manually.
- Show the
Data_Sinksheet being populated/updated with the new, correct values. - Switch to the
Dashboardtab and show the charts reflecting the newly aggregated data.
Evaluation Criteria
- Architectural Separation: The reporting workflow is standalone and does not touch your operational CRM workflows.
- Correct Aggregation: The
Codenode correctly calculates all required KPIs based on the data from the source sheet. The logic must be robust and handle edge cases (e.g., division by zero if there are no 'Won' or 'Lost' leads). - Data Flow: The workflow successfully reads from the source CRM sheet and writes the aggregated data to the
Data_Sinktab of the reporting sheet. - Dashboard Functionality: The charts and metrics on the
Dashboardtab are correctly configured to use the data from theData_Sinktab and update automatically when the data changes. - Clarity of Demonstration: Your video clearly shows the end-to-end process: raw data -> aggregation -> data sink -> dashboard update.
Conclusion
You have now built a complete, production-grade Agency CRM Automation Core. By implementing a separate reporting workflow, you've demonstrated a crucial system design principle: the separation of transactional and analytical processing. This ensures your system is not only functional but also resilient, scalable, and maintainable. Your portfolio now showcases an end-to-end solution that handles data intake, lifecycle management, stakeholder communication, and business intelligence.
Key Takeaways:
- Separation of Concerns: Transactional and analytical workflows should always be separate to ensure system stability and performance.
- Scheduled Jobs for Reporting: Reporting and data aggregation are typically handled by scheduled (batch) processes, not real-time triggers.
- Efficient Aggregation: The
Codenode'sRun once for all itemsmode is the most performant method for in-workflow data aggregation. - Dashboards as Data Consumers: A BI dashboard is a presentation layer that consumes clean, aggregated data. Your n8n workflow is the engine that prepares this data.
Preview of the Next Module:
You've mastered building a complex, internal system. Now, you'll apply these skills to a different, client-facing business process. The next module, Portfolio Project 3: Client Onboarding System, will challenge you to automate the critical first steps of a client relationship, from form intake to task generation and welcome sequences. This will further broaden the scope of your portfolio, proving your versatility as an automation engineer.