Introduction
This is the final lesson of the course and the culmination of your work. You began by translating the chemical principle of a limiting reactant into a systems thinking concept of a binding constraint. You then learned to apply the Theory of Constraints, perform backward induction, and use Pareto analysis to isolate bottlenecks. In the last two lessons, you built a mathematical framework—the model—to quantify your maximum potential and developed analytical methods to select high-leverage strategies for breaking your primary constraint.
This lesson integrates every one of these concepts into a single, comprehensive capstone project. The learning outcome is: Define a personal scientific research or professional goal and apply TOC, Pareto analysis, and the model to identify and quantify the primary bottleneck.
You will act as a systems analyst for your own career, conducting a full "bottleneck audit" on a goal of your choosing. The output will be a structured report that moves from a high-level objective to a data-driven, quantifiable, and actionable strategic recommendation. This project is the final step in mastering the art of strategic back-calculation and bottleneck identification.
Part 1: Defining the Strategic Objective
Every successful analysis begins with a clearly defined problem. Your first task is to select and articulate a personal goal related to your interests in scientific research or professional output. This goal must be specific, measurable, and time-bound.
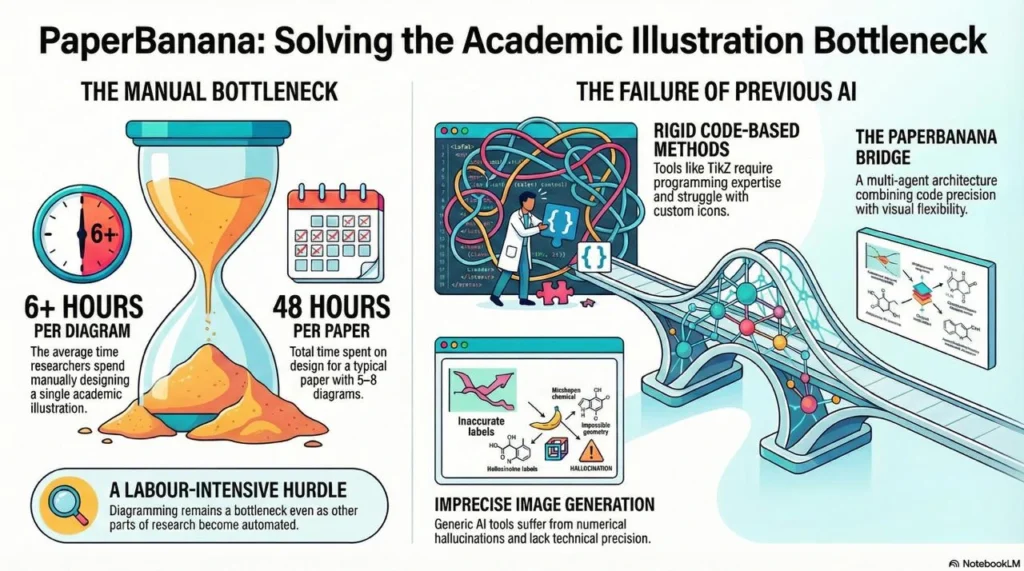
Consider the following image, which visualizes a bottleneck common in academic research.
Action Item 1: Formulate Your Goal
Choose a goal that is meaningful to you. Examples include:
- "Publish 3 first-author papers in top-tier quantum electrodynamics journals within the next 24 months."
- "Secure a research grant of at least $150,000 as the principal investigator within the next 18 months."
- "Complete my doctoral thesis and secure a postdoctoral position at a leading AI research lab within 3 years."
Action Item 2: Frame Your System
Once you have a goal, consider the high-level factors that contribute to achieving it. A useful conceptual framework comes from the academic paper on research productivity we've discussed previously.
Analytic model for academic research productivity having factors ...
To help structure your thinking about the resources and factors involved in your goal, revisit the 'Analytic model for academic research productivity'. Its 'six-alpha' model provides a robust starting point for identifying potential constraints.
Review the sections 'The Factors' and the descriptions of the six alpha variables: (1) Funding, (2) Investigator quality, (3) Institutional efficiency, (4) Research mix, (5) Analytic accuracy, and (6) Passion. Think about how these abstract factors manifest as concrete, measurable resources or constraints in your own context.
These "alpha" factors are conceptual, but they map directly to the tangible resources you will model in your formulation:
- Funding & Institutional Efficiency can combine into your Capital constraint.
- Investigator Quality & Passion can be represented by your Skill and Time constraints.
- External dependencies on colleagues, reviewers, or equipment access fall under the Gatekeepers constraint.
Part 2: The Project Blueprint: A Step-by-Step Guide
Your capstone project is a bottleneck audit. For a comprehensive example of what such an audit looks like in a professional setting, we can look at a study conducted in a hospital. This study mirrors the process you are about to undertake: identifying bottlenecks, categorizing them, measuring their impact, and evaluating interventions.
[PDF] Operational Bottlenecks and Workforce Efficiency
This research paper, 'Operational Bottlenecks and Workforce Efficiency', serves as an excellent template for your capstone project. It demonstrates how to systematically apply TOC and quantitative analysis in a real-world system.
Read the 'Abstract', 'Methodology', and 'Constraint Identification Matrix' sections. Pay close attention to how the researchers: Defined their objective (optimizing staff utilization). Collected data to identify and categorize constraints (human, procedural, technological). Used quantitative methods to analyze the findings.\nYour report will follow a similar logical structure.
Here is your four-step process for the audit.
Step 1: Qualitative Assessment (TOC)
Begin with a high-level application of the Theory of Constraints.
- Identify: Based on your experience and intuition, what is the single biggest constraint preventing you from moving faster toward your goal? Is it your available hours in the day? Access to a key collaborator? Lack of funding for experiments?
- Exploit: What are simple, immediate ways you could get more out of this constraint? (e.g., if time is the bottleneck, block out non-negotiable "deep work" sessions).
- Subordinate: How must all other activities align to the reality of this constraint? (e.g., if a collaborator's time is the bottleneck, ensure all materials are perfectly prepared before every meeting).
For a quick refresher on these steps, you can review this summary.
Theory of Constraints in production - 5 min. summary
To refresh your memory on the five focusing steps of TOC, watch this brief segment from the 'Theory of Constraints in production' video.
Watch the section from 03:31 to 04:42, which concisely outlines the process of Identify, Exploit, Subordinate, Elevate, and Repeat.
Step 2: Data-Driven Hypothesis Testing (Pareto Analysis)
Now, test your qualitative assessment with data.
- Collect Data: Track your work for a defined period (e.g., one or two weeks). Categorize sources of delay, interruption, or wasted effort. Examples of categories: "unplanned administrative tasks," "debugging code," "waiting for feedback," "context switching."
- Create a Pareto Chart: Plot the frequency or duration of these issues. Identify the "vital few" problems (the 20%) causing 80% of the negative impact.
- Analyze: Does the primary cause identified by your Pareto chart match your perceived bottleneck from Step 1? This analysis provides a data-backed hypothesis for what your primary constraint is.
You can revisit this tutorial if you need a reminder on creating and interpreting the chart.
Pareto Analysis (how to create a Pareto Chart, analyze results, and understand the 80 20 Rule)
This video provides a step-by-step guide to creating and analyzing a Pareto chart.
If needed, review the sections on creating the chart (02:49 - 06:48) and interpreting the results (06:48 - 10:08) to find the 'vital few' causes.
Step 3: Quantitative Modeling ()
Translate your system into a linear program.
- Formulate:
- Objective Function: Define your output units. E.g., , where is a journal paper and is a conference presentation. Assign weights based on their importance to your goal.
- Decision Variables: The outputs (, etc.).
- Constraints: Define your available resources for the time period of your goal (e.g., 24 months).
- Time:
- Capital:
- Gatekeeper:
- Skill: You can model this as a time constraint for a specific skill (e.g., "Time available for advanced statistical analysis") or as a binary prerequisite.
- Solve & Quantify:
- Use a tool like Excel Solver to find the optimal solution.
- From the sensitivity report, identify the binding constraint(s)—those with a slack of zero.
- Record the shadow price of each binding constraint. This is the quantified impact of your bottleneck. A shadow price of 5.5 for the Time constraint means one extra hour of your time will generate 5.5 more "impact units."
Step 4: Synthesis and Strategic Recommendation
This is where you connect all the pieces.
- Synthesize Findings: Compare the results from all three analyses. Does the binding constraint from your model align with the findings from your TOC and Pareto analyses? A strong alignment provides high confidence in your conclusion. A discrepancy suggests one of your initial assumptions or data points may need re-evaluation.
- Propose a Leverage Strategy: Based on the binding constraint and its shadow price, propose one specific, actionable leverage strategy ( or ) as you learned in the previous lesson.
- Quantify the Impact: Calculate the expected return on your proposed strategy. For example: "The binding constraint is Gatekeeper time, with a shadow price of 10 units/hour. Strategy: Spend 20 hours of my own time (opportunity cost = 20 * my time's shadow price) to create a streamlined collaboration protocol. This is projected to reduce Gatekeeper time per project by 5 hours (a strategy). For 4 planned projects, this frees up 20 Gatekeeper hours, for an expected gross benefit of impact units."
Part 3: The Bottleneck Audit Report
Your final deliverable is a concise report that documents your findings and your strategic plan. Structure it logically, mirroring the steps of your analysis.
Report Template:
- 1. Strategic Objective:
- State your defined personal goal.
- 2. Qualitative Bottleneck Assessment (TOC):
- Briefly describe your perceived primary constraint and the logic behind it.
- 3. Data-Driven Bottleneck Identification (Pareto Analysis):
- Include your Pareto chart.
- State the "vital few" causes of inefficiency identified from your data.
- 4. Model and Quantitative Analysis:
- State your objective function and constraints.
- Report the optimal solution ( value).
- Clearly identify the binding constraint and its shadow price.
- 5. Synthesis and Recommendation:
- Synthesize the findings from steps 2, 3, and 4 to declare the primary, quantified bottleneck.
- State your proposed leverage strategy.
- Present the calculation for the strategy's expected impact on your .
Conclusion
You have now completed the entire framework, from abstract principle to applied strategy. This capstone project is not merely an academic exercise; it is a blueprint for a continuous process of self-auditing and strategic optimization that you can apply to any complex goal you pursue. By systematically identifying and addressing the single factor that most limits your progress, you can ensure your efforts are always applied where they will generate the highest possible return.
Key Takeaways:
- Synthesize Multiple Frameworks: The most robust bottleneck analysis combines qualitative intuition (TOC), empirical data (Pareto), and quantitative modeling ().
- From Diagnosis to Action: The goal of the audit is not just to identify the bottleneck but to quantify its impact via the shadow price, enabling an evidence-based choice of leverage strategy.
- An Iterative Process: As you elevate one constraint, a new one will eventually emerge. This analytical cycle—Identify, Quantify, Leverage, Repeat—is the engine of sustained high performance.
This concludes the course. You are now equipped with a powerful and versatile toolkit for maximizing your potential in any field.